
Menu

Grafana Cloud

Kubernetes Monitoring
Monitor and troubleshoot your fleet with dashboards and alerts that you don’t have to create. View resource usage, and identify issues quickly. The Kubernetes Monitoring application is available in Grafana Cloud.
Overview
The Kubernetes Monitoring app gives you what you need to understand and manage your infrastructure, including:
A single platform for complete monitoring and visibility. You can check the health of your Kubernetes objects and troubleshoot issues without leaving the app. This helps you solve problems faster and with less effort.
A ready-to-use experience that includes tools for tracking cost, resource efficiency, jobs, and energy use. You also get built-in alerts, alert rules that define when alerts fire, recording rules that pre-compute query results, and cost and resource-use forecasts.
Guidance and help

Not sure where to go?
Answer a few questions and Grot will show you a helpful next step.
Explore
Introduction
Discover more about the advantages that Kubernetes Monitoring offers and what comes out of the box.
Explore your infrastructure
Dive into the features of Kubernetes Monitoring as a one-app experience.
Triage your infrastructure
Triage fleet health and drill into availability, stability, and infrastructure issues from Kubernetes Overview.
Configure
Activate Kubernetes Monitoring, then deploy the Grafana Kubernetes Monitoring Helm chart with the configuration wizard or a values file. Learn how to customize and troubleshoot your configuration.
Manage costs
Cost views are available at every level of the app’s interface to show spending estimates and how to save.
Optimize resource and efficiency
Use optimization data and recommendations to optimize CPU and memory usage. Follow example use cases to handle resource issues.
Respond to alerts
Deal solely with alerts for Kubernetes, and manage them.
Monitor jobs
Monitor manual jobs and scheduled (cron) jobs across all Clusters and namespaces.
Monitor non-standard workloads
Find and monitor non-standard workloads such as Argo Rollouts, Strimzi PodSets, static Pods, and bare Pods.
Host-hours pricing
Learn how host-hours pricing works for Kubernetes Monitoring.
Was this page helpful?
Related resources from Grafana Labs

Video
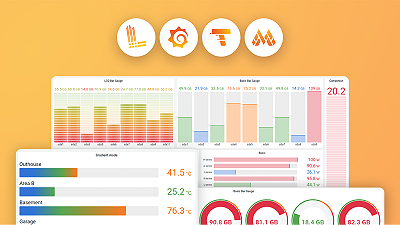
Getting started with managing your metrics, logs, and traces using Grafana
In this webinar, we’ll demo how to get started using the LGTM Stack: Loki for logs, Grafana for visualization, Tempo for traces, and Mimir for metrics.
Video

Start with Grafana Assistant
Learn how Grafana Assistant helps teams get answers faster using AI—without writing PromQL. Join this webinar to discover prompting best practices and security FAQs.
Video

Building advanced Grafana dashboards
In this webinar, we’ll demo how to build and format Grafana dashboards.