Why observability needs FinOps, and vice versa: the Vantage integration with Grafana CloudCost management
How to integrate performance testing and continuous profiling for deeper application insightsPerformance TestingLoad testingGrafana Cloud k6Grafana Cloud Profilesk6Grafana Pyroscope
Grafana 11.5 release: easily share Grafana dashboards and panels, secure frontend code for plugins, and moreGrafana
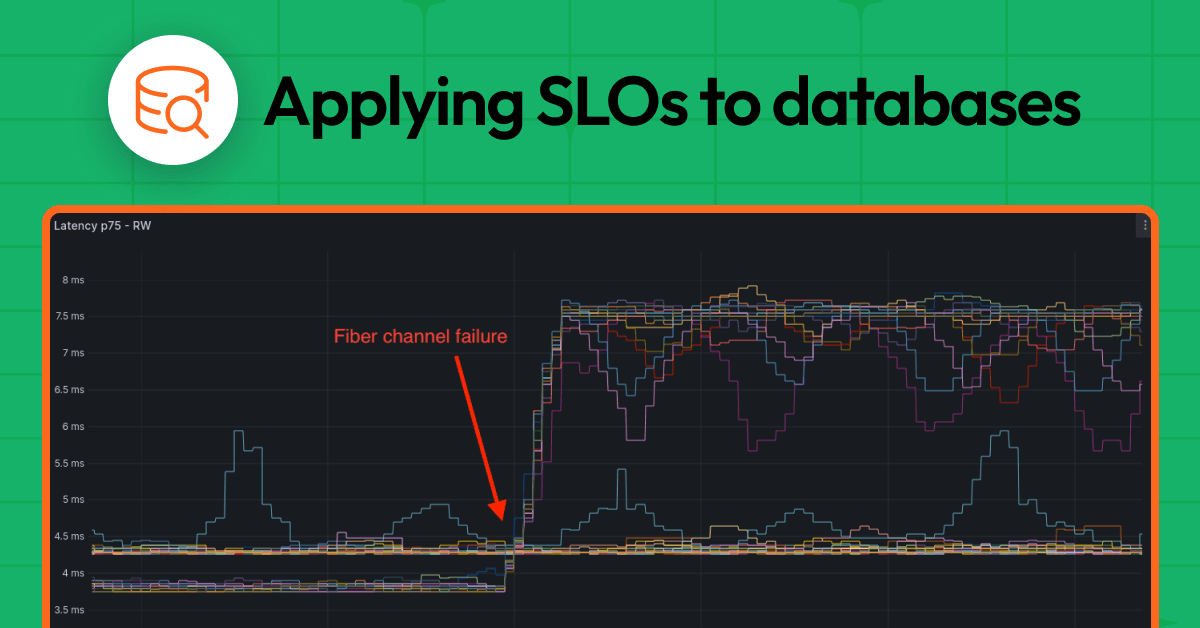
Databases and SLOs: How to apply service level objectives to your databases with synthetic monitoringCommunitySynthetic monitoringGrafana SLO
Kubernetes Monitoring Helm chart 2.0: a simpler, more predictable experienceKubernetes MonitoringGrafana Cloud
Grafana Cloud updates: tools to streamline performance testing, a new Adaptive Logs feature, and moreGrafana CloudGrafana Cloud k6
Demystifying the OpenTelemetry Operator: Observing Kubernetes applications without writing codeOpenTelemetryKubernetesApplication observability
What is Adaptive Telemetry, and how can it reduce MTTR, noise, and cost?Adaptive MetricsGrafana CloudMTTRCost management
3D printing and observability: How Prusa Research monitors its huge printer farm with GrafanaObservabilityGrafana
Take Grafana Labs' 5th annual Observability SurveyThe Observability Survey is your chance to weigh in on the pressing issues facing observability leaders and practitioners today. Take it today and enter for a chance to win special Grafana swag.Observability
Grafana Labs named a Leader again in the 2026 Gartner® Magic Quadrant™ for Observability PlatformsObservabilityGrafana Cloud
Coverage-first or cost-first: two ways to automatically apply Adaptive Metrics' recommendations Adaptive TelemetryAdaptive MetricsGrafana CloudCost management
Manage your OpenTelemetry Collectors with Fleet Management in Grafana CloudFleet ManagementGrafana AlloyGrafana Cloud
Manage synthetic checks at scale: Introducing folders in Grafana Cloud Synthetic MonitoringSynthetic monitoringGrafana Cloud