Prometheus 3.0 and OpenTelemetry: a practical guide to storing and querying OTel dataPrometheusOpenTelemetryOpen Source
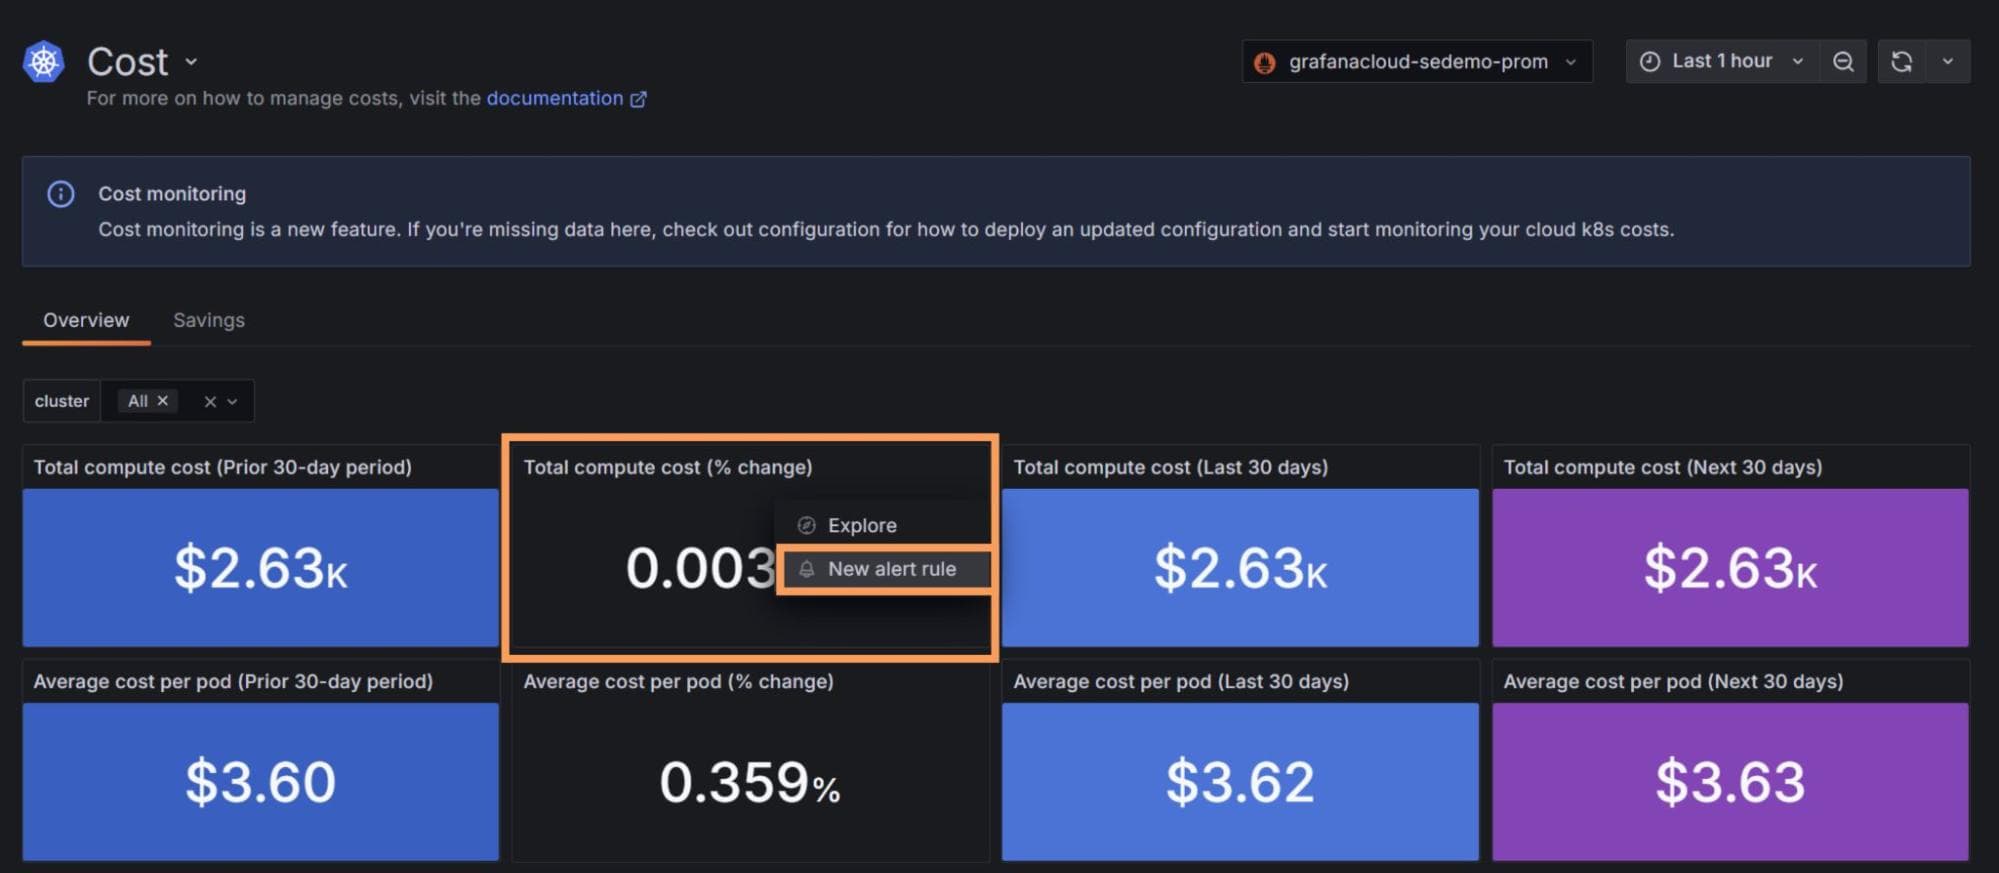
Creating alerts from panels in Kubernetes Monitoring: an overlooked, powerhouse featureKubernetes MonitoringKubernetesAlerting
Grafana Cloud in Indonesia: Learn how we’re meeting users where they are with our latest regionEventsGrafana Cloud
Visualize GitHub repos, projects, and more: get started with the GitHub data source for GrafanaPluginsDevOpsGrafana CloudGrafana
Grafana 11.3 release: Scenes-powered dashboards, visualization and panel updates, and moreGrafanaReleaseDrilldown
From multi-line queries to no-code investigations: meeting Grafana users where they areGrafana EnterpriseGrafana CloudGrafanaDrilldown
Monitor your generative AI app with the AI Observability solution in Grafana CloudAIIntegrationsGrafana Cloud
How to quickly configure Grafana Cloud Application Observability with OpenTelemetry OperatorApplication observabilityOpenTelemetryGrafana CloudDrilldown
Grafana Cloud updates: k6 browser checks in Synthetic Monitoring, an easier way to share dashboards, and moreGrafana CloudSynthetic monitoring
Visualize Atlassian Statuspage, Cloudflare, and Netlify data: what’s new in Grafana Enterprise data source pluginsPluginsGrafana CloudGrafana Enterprise
Take Grafana Labs' 5th annual Observability SurveyThe Observability Survey is your chance to weigh in on the pressing issues facing observability leaders and practitioners today. Take it today and enter for a chance to win special Grafana swag.Observability
Grafana Labs named a Leader again in the 2026 Gartner® Magic Quadrant™ for Observability PlatformsObservabilityGrafana Cloud
Coverage-first or cost-first: two ways to automatically apply Adaptive Metrics' recommendations Adaptive TelemetryAdaptive MetricsGrafana CloudCost management
Manage your OpenTelemetry Collectors with Fleet Management in Grafana CloudFleet ManagementGrafana AlloyGrafana Cloud
Manage synthetic checks at scale: Introducing folders in Grafana Cloud Synthetic MonitoringSynthetic monitoringGrafana Cloud