Watch Grafana 10 demos: New visualizations, plugin tools, and more from the latest Grafana releaseEngineering
Grafana k6 v0.45.0 release: gRPC streaming support, cloud script updates without running tests and more!k6
New in Grafana 10: Securely monitor and query network-secured data sources from Grafana CloudGrafana Cloud
Grafana security release: New versions of Grafana with a critical security fix for CVE-2023-3128Security
HIRE Learning with Just Eat Takeaway: ‘I want to make sure everybody feels included and heard’Community
How many metrics? A guide to estimating the size of your system in Grafana CloudGrafana CloudPrometheusGraphite
How to observe your TensorFlow Serving instances with Grafana CloudIntegrationsGrafana CloudMonitoringMachine learning
Meet our Golden Grot Awards grand prize winners!CommunityGrafanaConDashboardGolden GrotsGolden Grot winners
GrafanaCON 2023 Day 2 Recap: A Grafana 10 deep-dive, Grafana Tempo and Mimir updates, home automation, and moreEvents
Take Grafana Labs' 5th annual Observability SurveyThe Observability Survey is your chance to weigh in on the pressing issues facing observability leaders and practitioners today. Take it today and enter for a chance to win special Grafana swag.Observability
Grafana Labs named a Leader again in the 2026 Gartner® Magic Quadrant™ for Observability PlatformsObservabilityGrafana Cloud
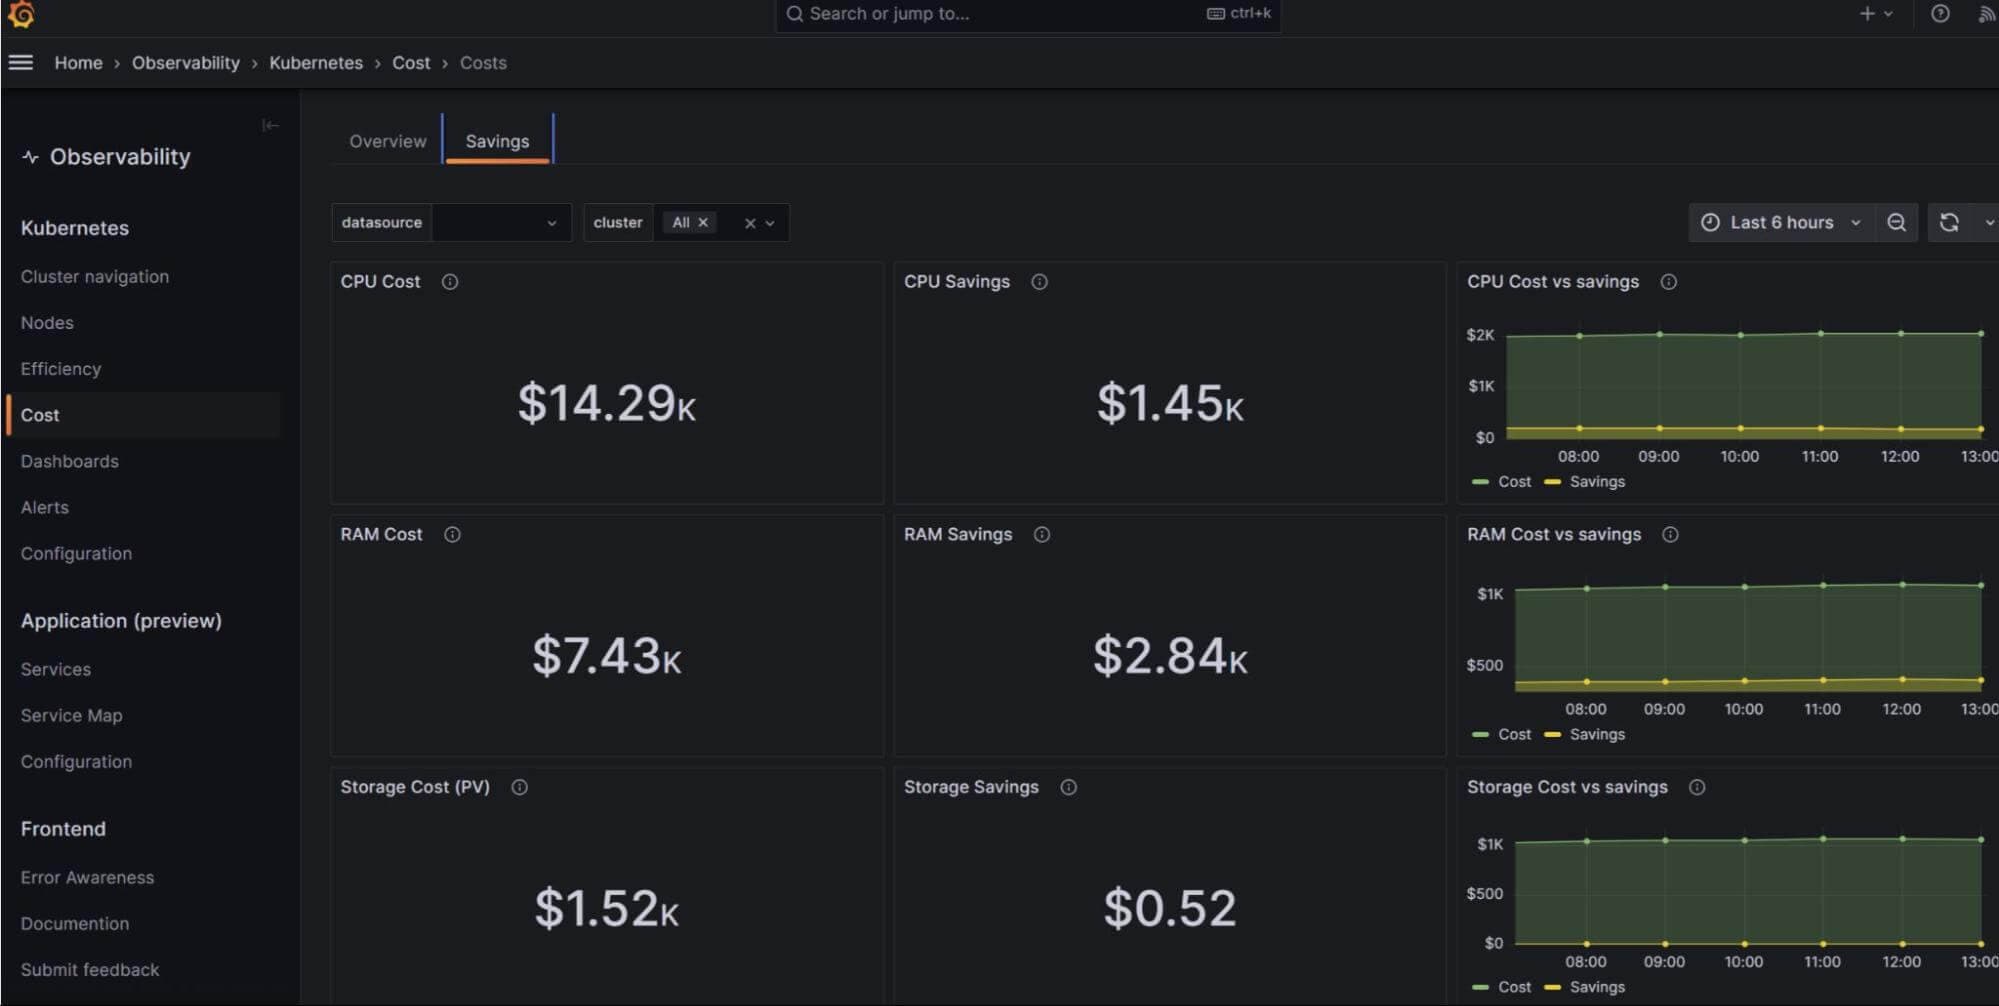
Coverage-first or cost-first: two ways to automatically apply Adaptive Metrics' recommendations Adaptive TelemetryAdaptive MetricsGrafana CloudCost management
Manage your OpenTelemetry Collectors with Fleet Management in Grafana CloudFleet ManagementGrafana AlloyGrafana Cloud
Manage synthetic checks at scale: Introducing folders in Grafana Cloud Synthetic MonitoringSynthetic monitoringGrafana Cloud