Grafana 9.5 release: Grafana Alerting updates, stronger security with service accounts, upgraded dashboards, and moreReleaseGrafana
Grafana security release: New versions of Grafana with security fixes for CVE-2023-28119 and CVE-2023-1387GrafanaSecurity
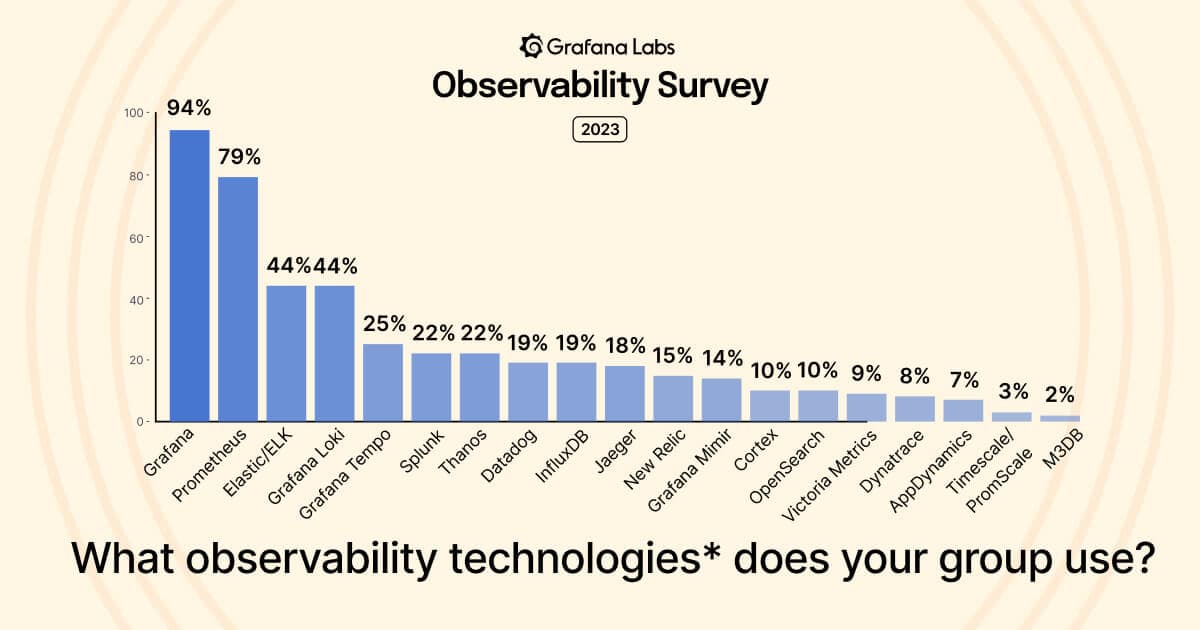
Observability overload: Insights into the rise of tools, data sources, and environments in use todayObservability
KubeCon + CloudNativeCon EU 2023 preview: Prometheus, OpenTelemetry, load testing, and more!Kubernetes
Grafana Alerting: Searching for Grafana alerts just got faster, easier, and more accurateAlertingGrafana
How to visualize k6 results: guidelines for choosing the right metricsLoad testingPerformance Testing
Grafana Loki 2.8 release: TSDB GA, LogQL enhancements, and a third target for scalable modeLoggingGrafana Enterprise LogsLokiRelease
Take Grafana Labs' 5th annual Observability SurveyThe Observability Survey is your chance to weigh in on the pressing issues facing observability leaders and practitioners today. Take it today and enter for a chance to win special Grafana swag.Observability
Grafana Labs named a Leader again in the 2026 Gartner® Magic Quadrant™ for Observability PlatformsObservabilityGrafana Cloud
Coverage-first or cost-first: two ways to automatically apply Adaptive Metrics' recommendations Adaptive TelemetryAdaptive MetricsGrafana CloudCost management
Manage your OpenTelemetry Collectors with Fleet Management in Grafana CloudFleet ManagementGrafana AlloyGrafana Cloud
Manage synthetic checks at scale: Introducing folders in Grafana Cloud Synthetic MonitoringSynthetic monitoringGrafana Cloud