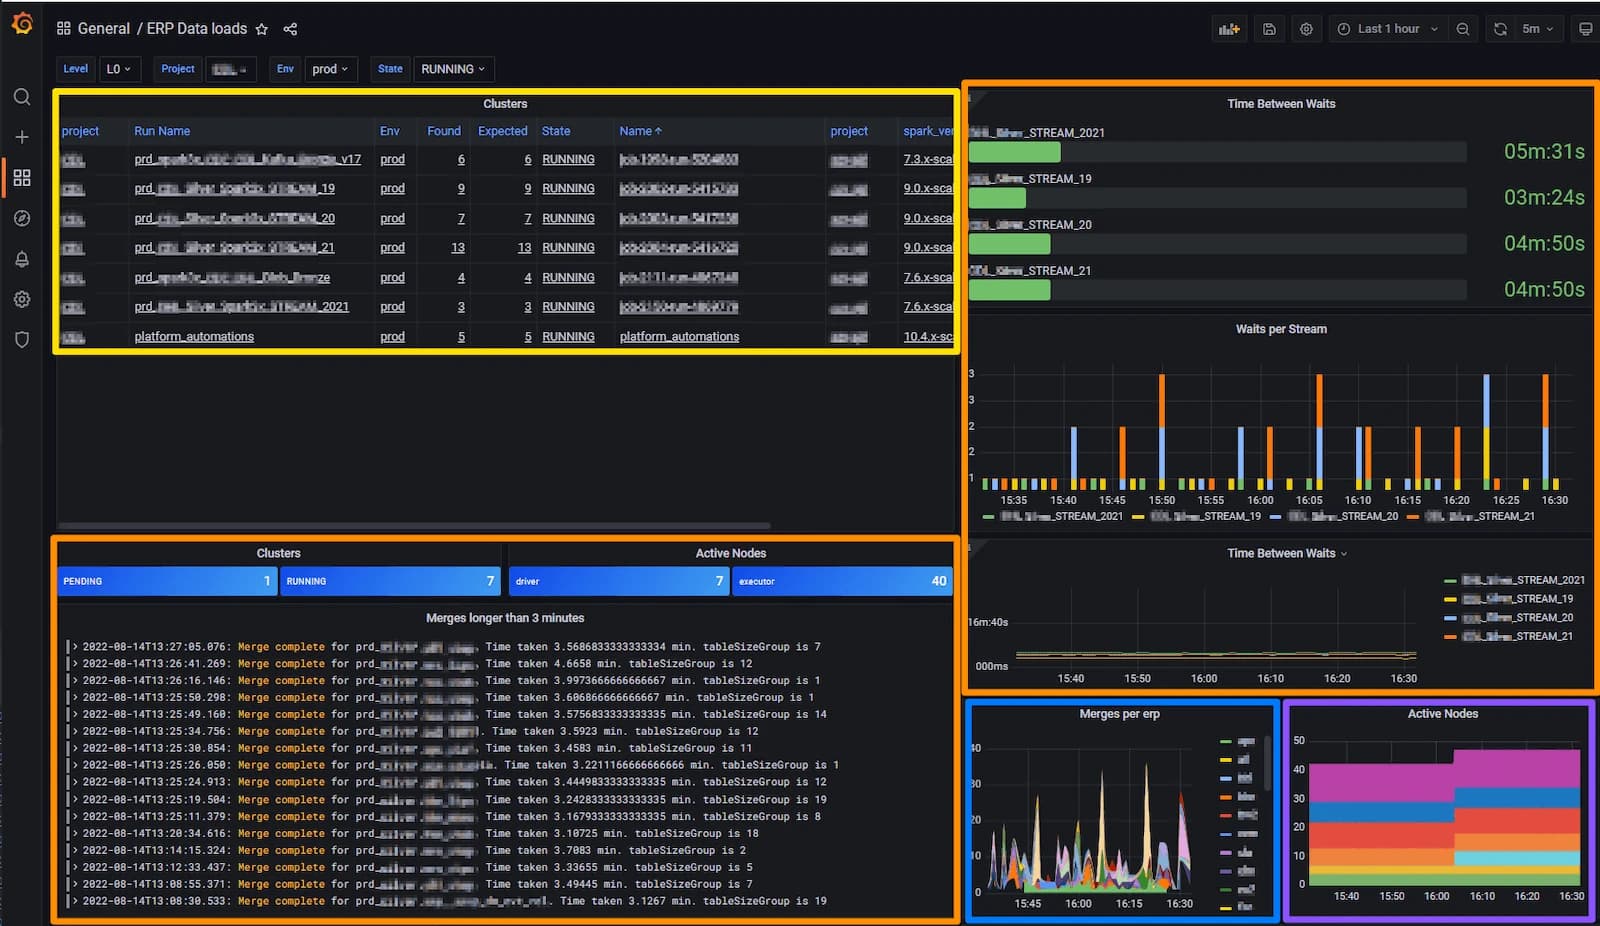
How to build a Formula 1 real-time analytics stack with Azure Data Explorer and Grafana CloudGrafanaConGrafana Cloud
How flame graphs visualize continuous profiling data in Grafana PhlareContinuous profilingGrafana Phlare
Security release: New version of Synthetic Monitoring Agent with a high severity fix for CVE-2022-46156Security
Grafana 9.3 release: Enhanced navigation, Grafana localization, Grafana Alerting updates, and more!Grafana
How to centralize thousands of data sources with Grafana: Inside Adform’s observability systemDevOpsGrafana
Introducing the Cilium Enterprise integration in Grafana Cloud for Kubernetes network monitoringIntegrationsGrafana Cloud
Take Grafana Labs' 5th annual Observability SurveyThe Observability Survey is your chance to weigh in on the pressing issues facing observability leaders and practitioners today. Take it today and enter for a chance to win special Grafana swag.Observability
Grafana Labs named a Leader again in the 2026 Gartner® Magic Quadrant™ for Observability PlatformsObservabilityGrafana Cloud
Coverage-first or cost-first: two ways to automatically apply Adaptive Metrics' recommendations Adaptive TelemetryAdaptive MetricsGrafana CloudCost management
Manage your OpenTelemetry Collectors with Fleet Management in Grafana CloudFleet ManagementGrafana AlloyGrafana Cloud
Manage synthetic checks at scale: Introducing folders in Grafana Cloud Synthetic MonitoringSynthetic monitoringGrafana Cloud