Grafana Tempo 1.5 release: New metrics features with OpenTelemetry, Parquet support, and the path to 2.0Tempo
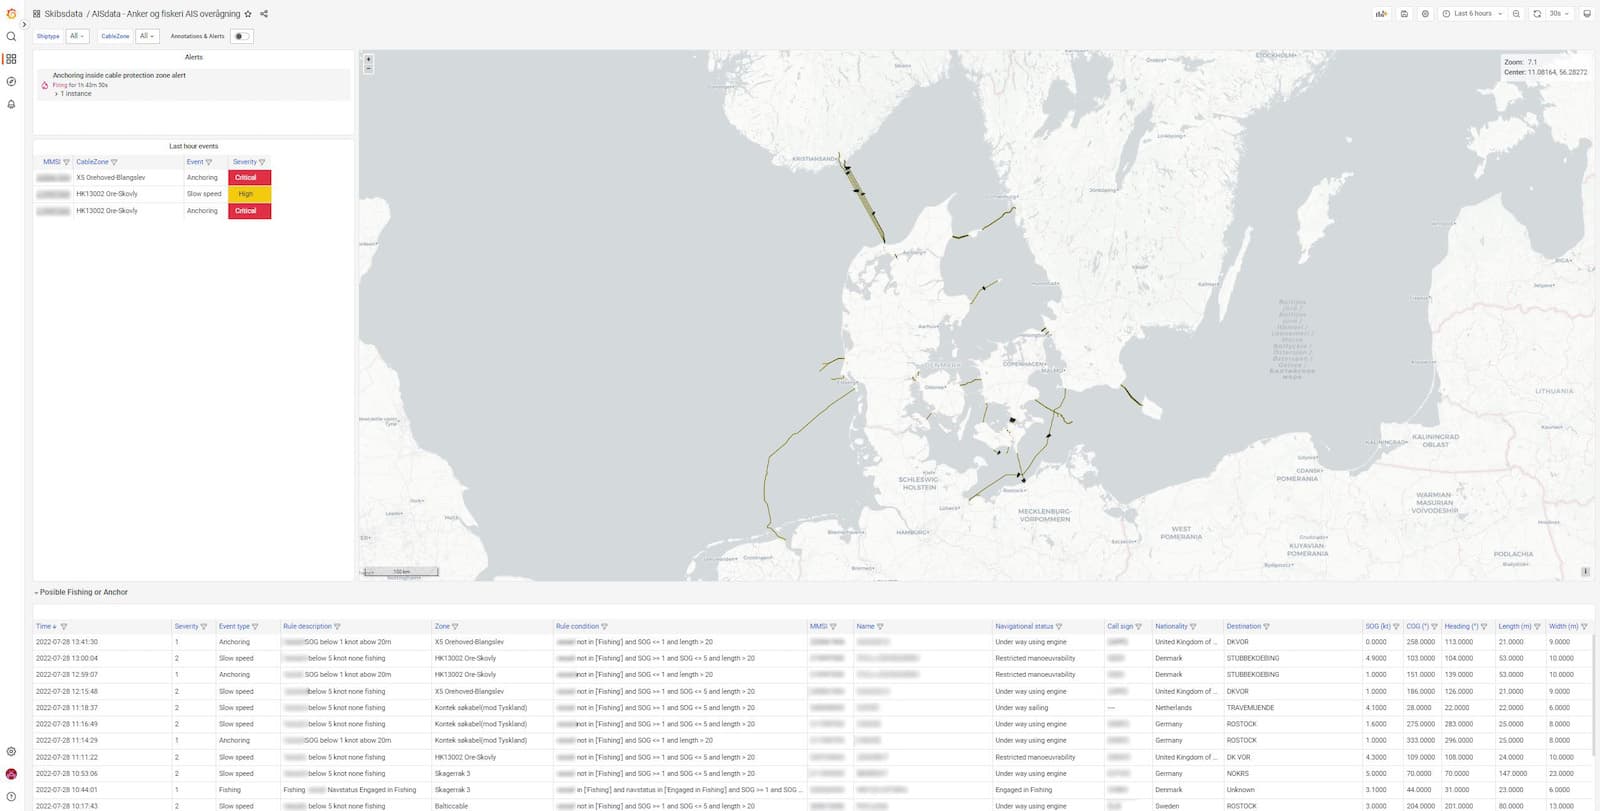
How Denmark’s Energinet uses Grafana Enterprise to monitor underwater energy cables — and do detective workGrafana EnterpriseGrafana
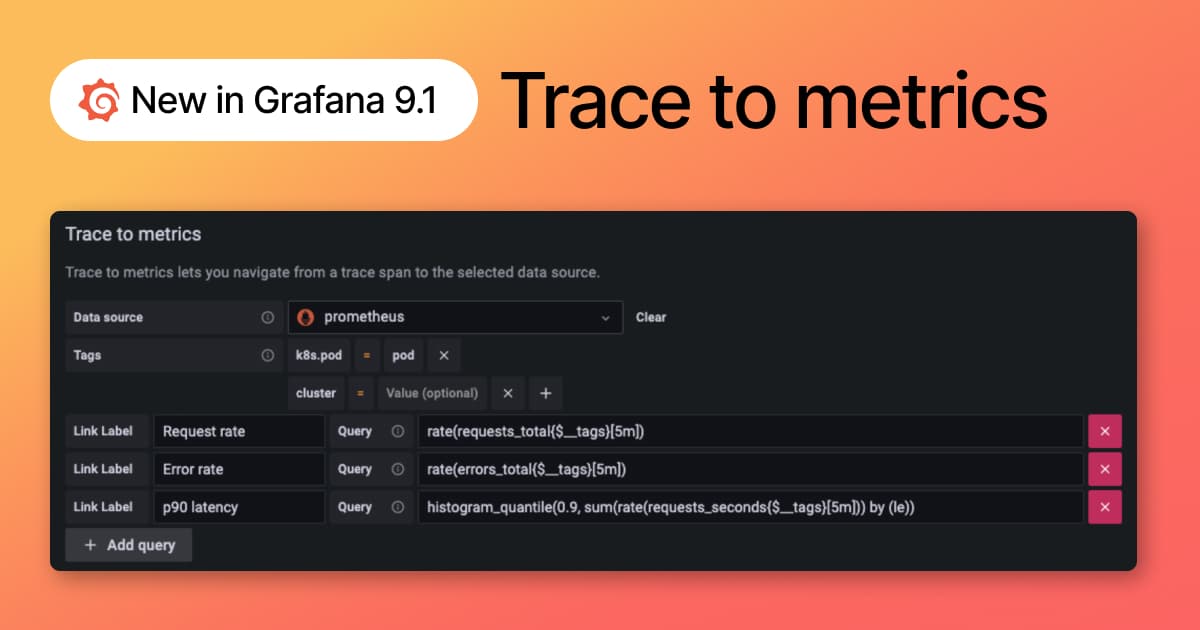
New in Grafana 9.1: Trace to metrics allows users to navigate from a trace span to a selected data sourceGrafanaTempo
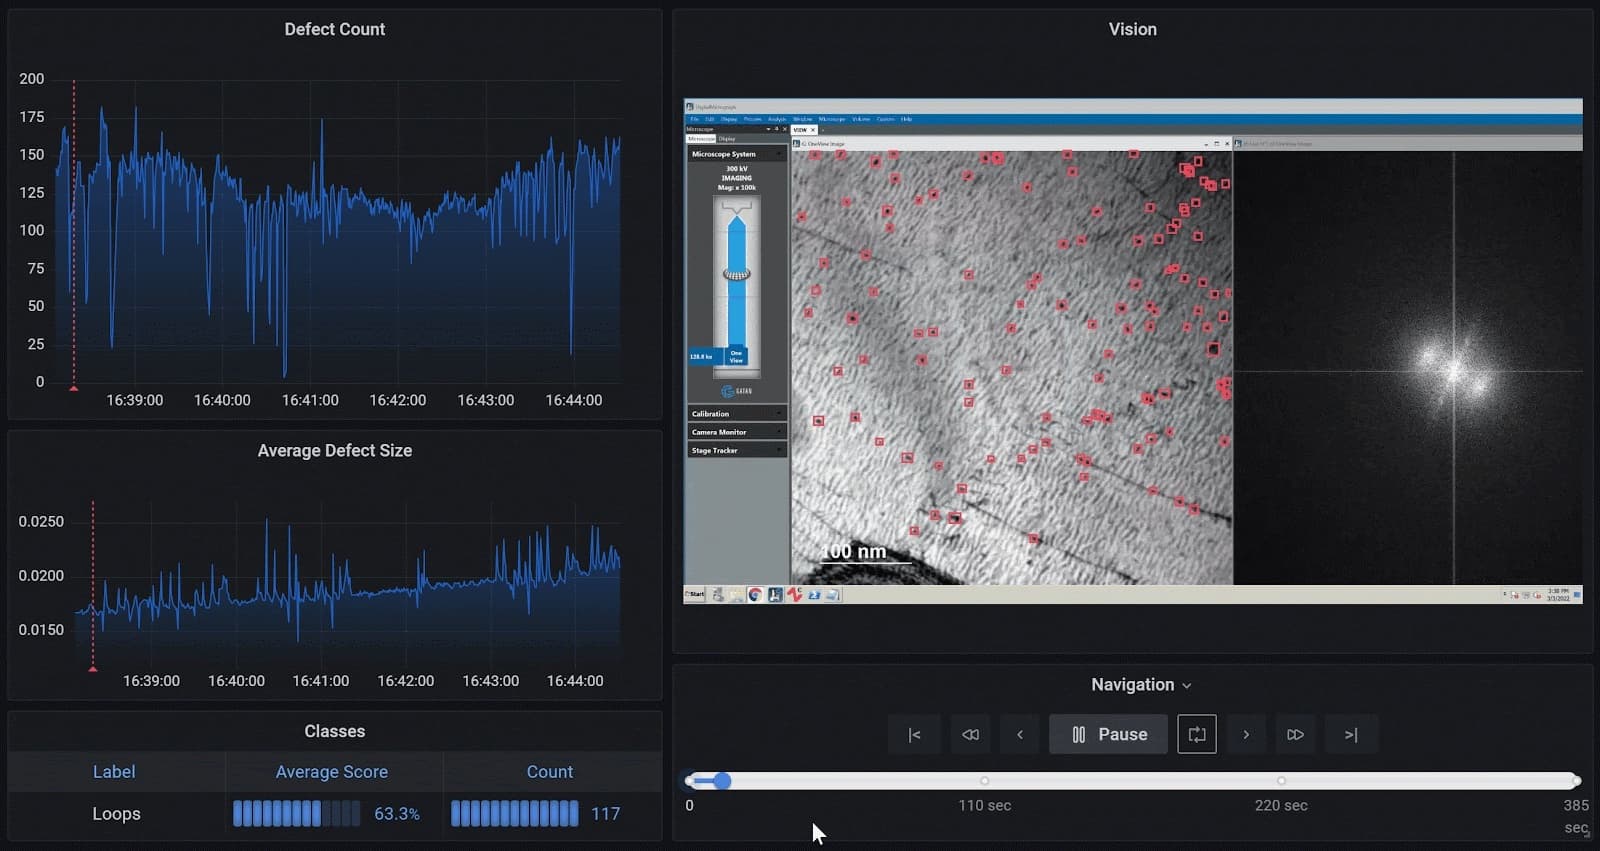
Using Grafana and machine learning to analyze microscopy images: Inside Theia Scientific’s workGrafanaIoT
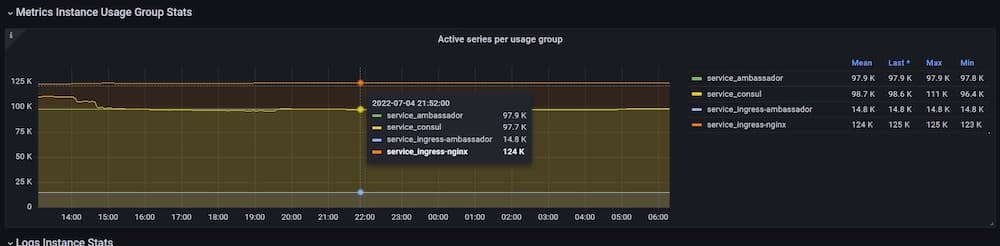
Grafana usage insights: How to track who is sending what metrics to your stack in Grafana CloudGrafanaGrafana Cloud
The updated Docker integration in Grafana Cloud now supports logs and metricsIntegrationsGrafana Cloud
Monitoring smart city IoT devices with Grafana and Grafana Loki: Inside the Fuelics observability stackGrafanaCon
New in Grafana Loki 2.6: multi-tenant queries and targeted log line deletionLokiLoggingGrafana Enterprise Logs
Introducing instant Kubernetes logging with Kubernetes Monitoring in Grafana CloudKubernetesGrafana Cloud
New in Grafana Mimir: Ingest Graphite, Datadog, Influx, and Prometheus metrics into a single storage backendMimir
Take Grafana Labs' 5th annual Observability SurveyThe Observability Survey is your chance to weigh in on the pressing issues facing observability leaders and practitioners today. Take it today and enter for a chance to win special Grafana swag.Observability
Grafana Labs named a Leader again in the 2026 Gartner® Magic Quadrant™ for Observability PlatformsObservabilityGrafana Cloud
Coverage-first or cost-first: two ways to automatically apply Adaptive Metrics' recommendations Adaptive TelemetryAdaptive MetricsGrafana CloudCost management
Manage your OpenTelemetry Collectors with Fleet Management in Grafana CloudFleet ManagementGrafana AlloyGrafana Cloud
Manage synthetic checks at scale: Introducing folders in Grafana Cloud Synthetic MonitoringSynthetic monitoringGrafana Cloud