Welcome to ‘Grafana’s Big Tent’ — a podcast about people, community, tech, and tools around observabilityObservabilityPodcasts
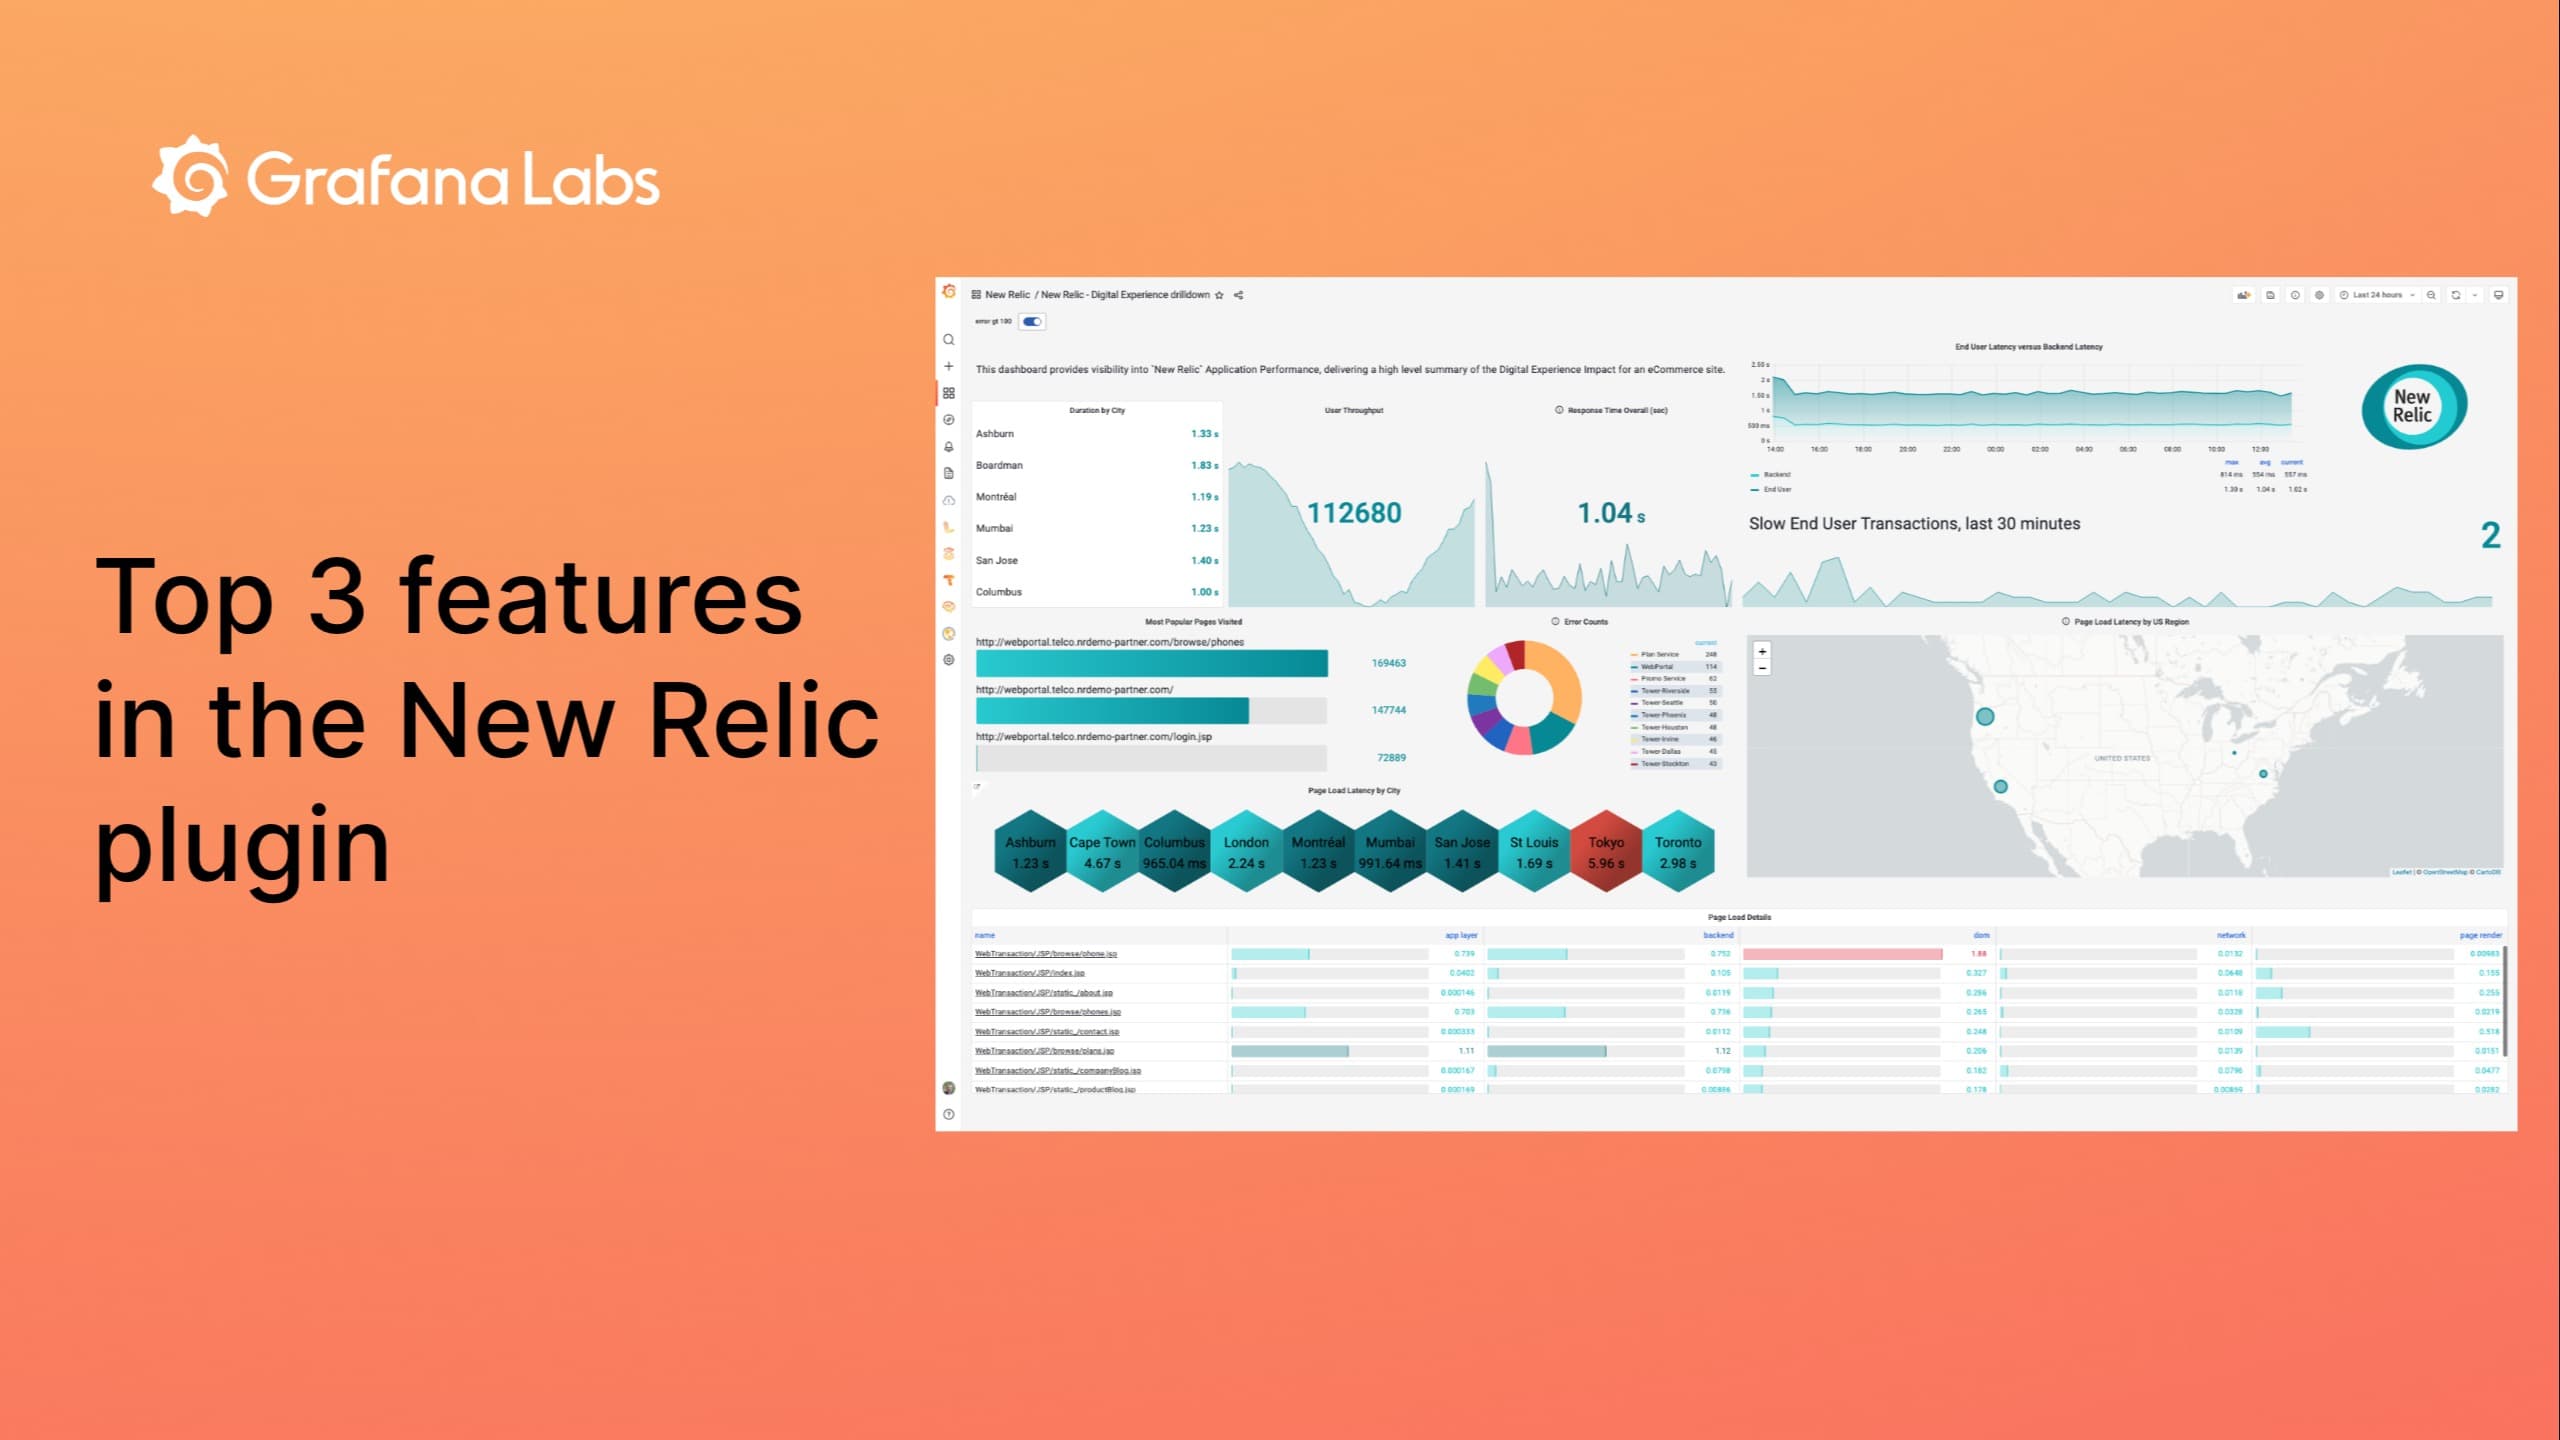
Video: Top 3 features of the New Relic data source plugin for Grafana EnterprisePluginsGrafana EnterpriseGrafana CloudDashboard
Security update: Grafana Labs does not believe it has been impacted by the Okta Lapsus\$ breachSecurity
Managed self-hosted Git service Gitea with the new integration for Grafana CloudGrafana CloudIntegrations
Learn about log data privacy, tracing at scale, alerting, and on-call management in our new webinarsEventsLokiTempo
Best practices for alerting on Synthetic Monitoring metrics in Grafana CloudAlertingSynthetic monitoringGrafana CloudPrometheus
Take Grafana Labs' 5th annual Observability SurveyThe Observability Survey is your chance to weigh in on the pressing issues facing observability leaders and practitioners today. Take it today and enter for a chance to win special Grafana swag.Observability
Grafana Labs named a Leader again in the 2026 Gartner® Magic Quadrant™ for Observability PlatformsObservabilityGrafana Cloud
Coverage-first or cost-first: two ways to automatically apply Adaptive Metrics' recommendations Adaptive TelemetryAdaptive MetricsGrafana CloudCost management
Manage your OpenTelemetry Collectors with Fleet Management in Grafana CloudFleet ManagementGrafana AlloyGrafana Cloud
Manage synthetic checks at scale: Introducing folders in Grafana Cloud Synthetic MonitoringSynthetic monitoringGrafana Cloud