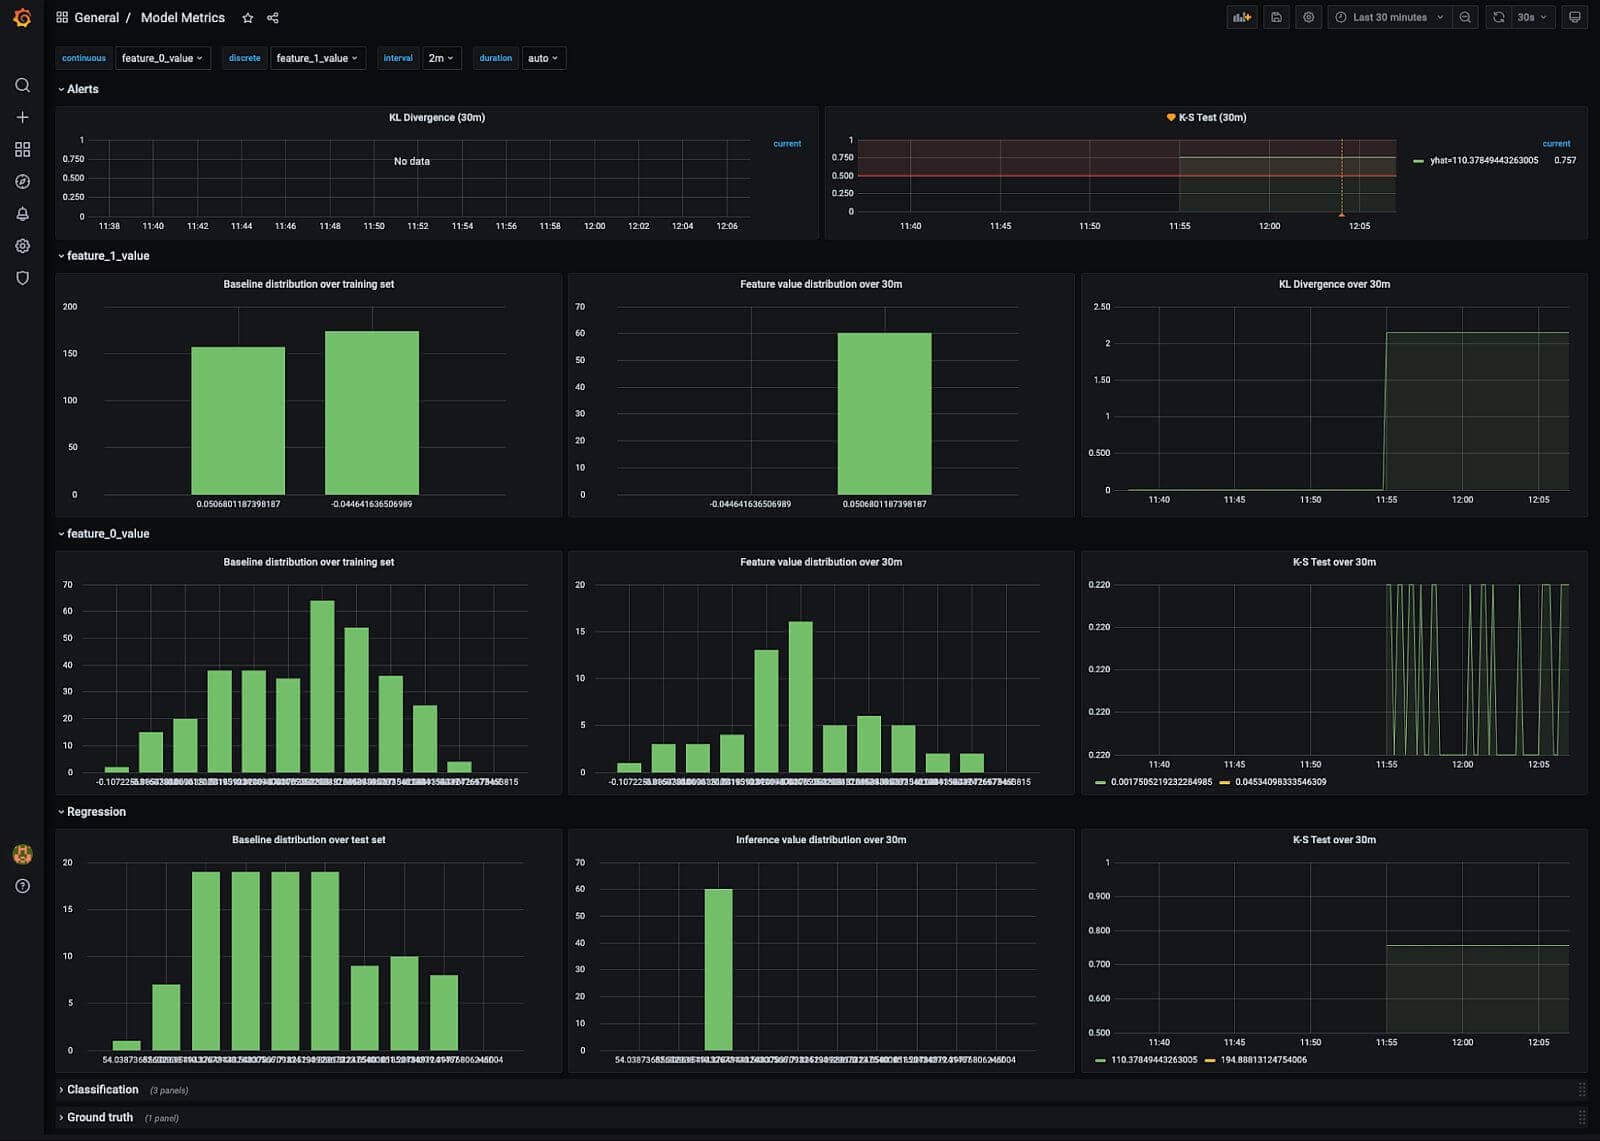
How BasisAI uses Grafana and Prometheus to monitor model drift in machine learning workloadsGrafanaMachine learningPrometheus
How we’re working with the Elastic team to make the Elasticsearch data source for Grafana even more powerfulPluginsElasticsearchGrafana
Grafana Labs joins the CNCF Governing Board as a Platinum member of the open source foundationCompany newsOpen SourcePrometheus
Learn how to use the Jira, ServiceNow, GitHub, and GitLab plugins for Grafana for better visibility into software developmentPlugins
Get comprehensive monitoring for your Apache Kafka ecosystem instances quickly with Grafana CloudGrafana CloudIntegrations
How Grafana helps organizations manage SLOs across multiple monitoring data sourcesAlertingGrafana CloudGrafana Enterprise MetricsGrafana
Grafana Labs welcomes the Pace.dev team, experts in building tools with great developer experienceCompany news
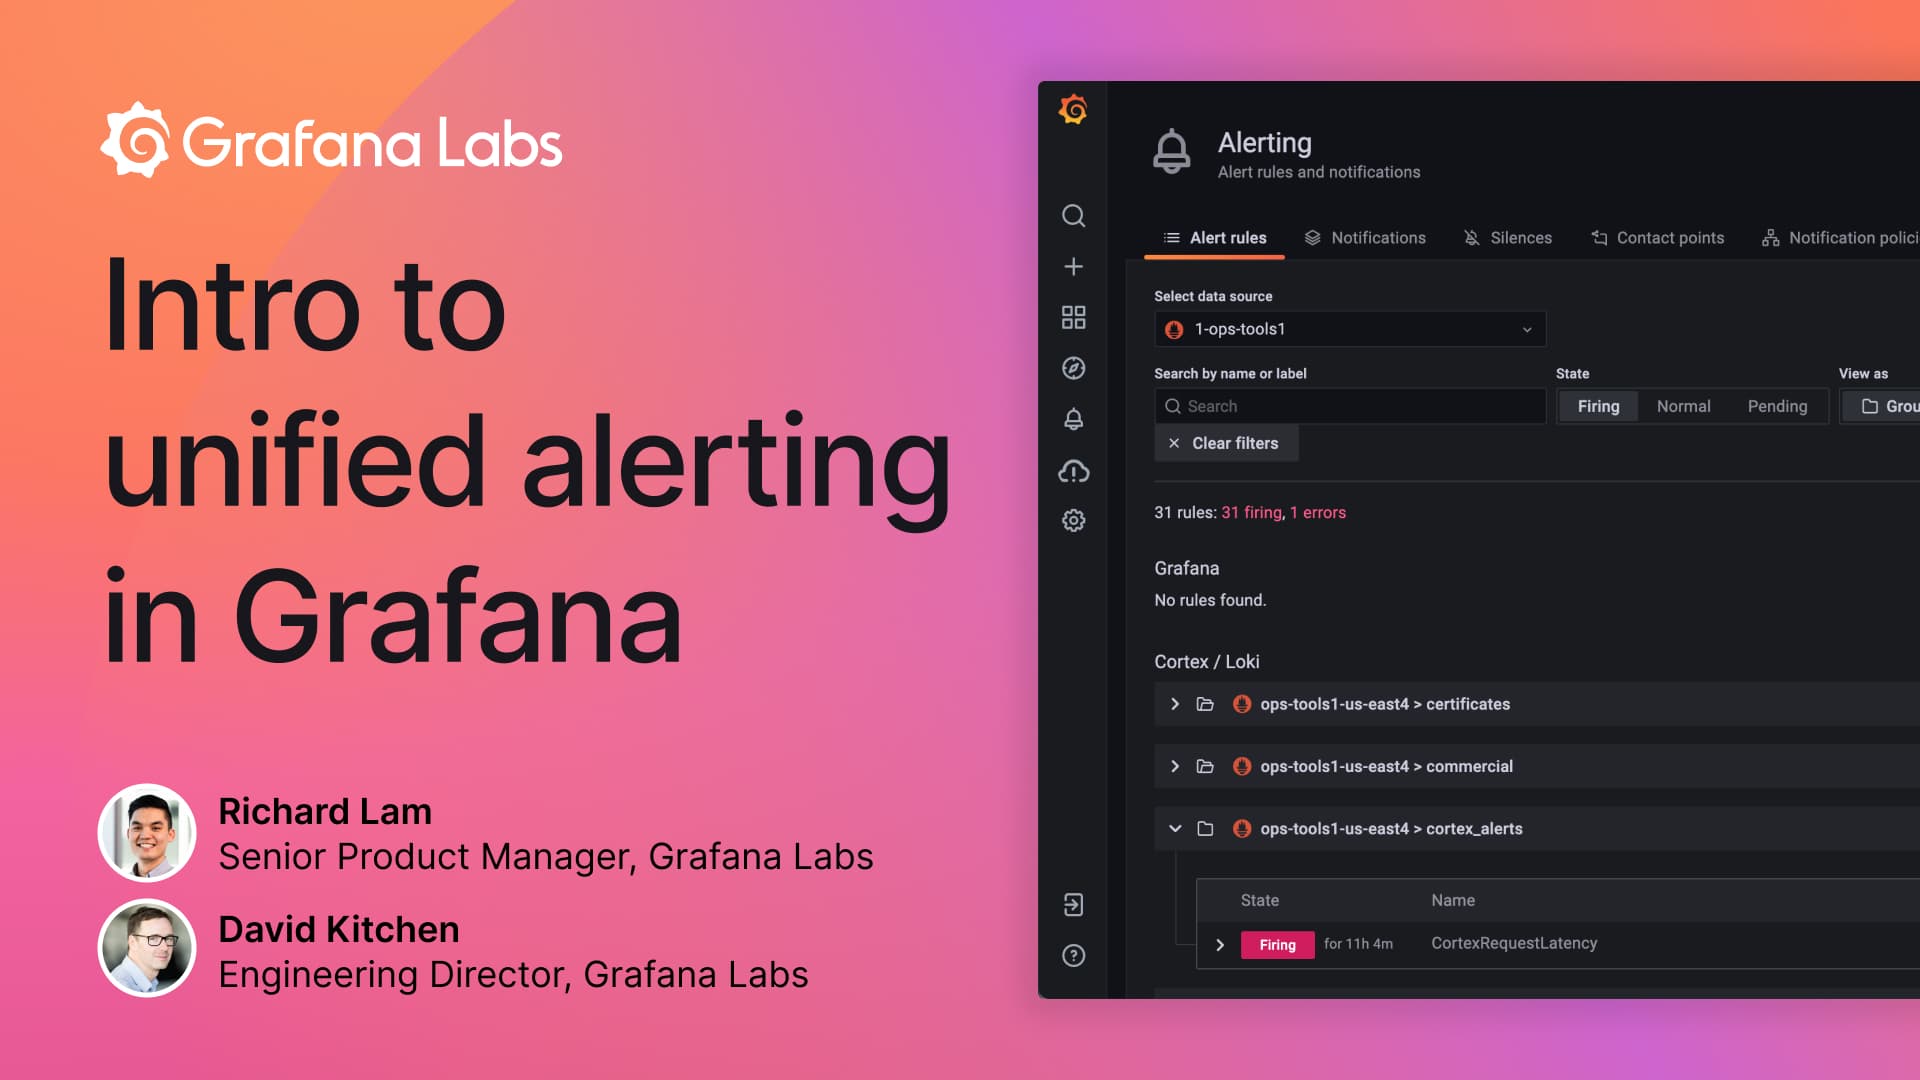
Learn more about the new alerting system in Grafana in this week’s webinarAlertingGrafanaGrafana CloudPrometheus
How Pernod Ricard uses Grafana and Loki to scale and monitor its global e-commerce businessGrafanaLoki
IoT at your home, work, or data center with Prometheus metrics and Grafana CloudGrafana CloudIoTPrometheus
How to visualize your business performance with cohort tables using Grafana and BigQueryGrafana Cloud
Get even more insights from Jira + Grafana with the latest Grafana Cloud integrationGrafana CloudIntegrations
How astronomers use Grafana dashboards to read the stars (and their data) on the SOFIA airborne observatoryGrafana
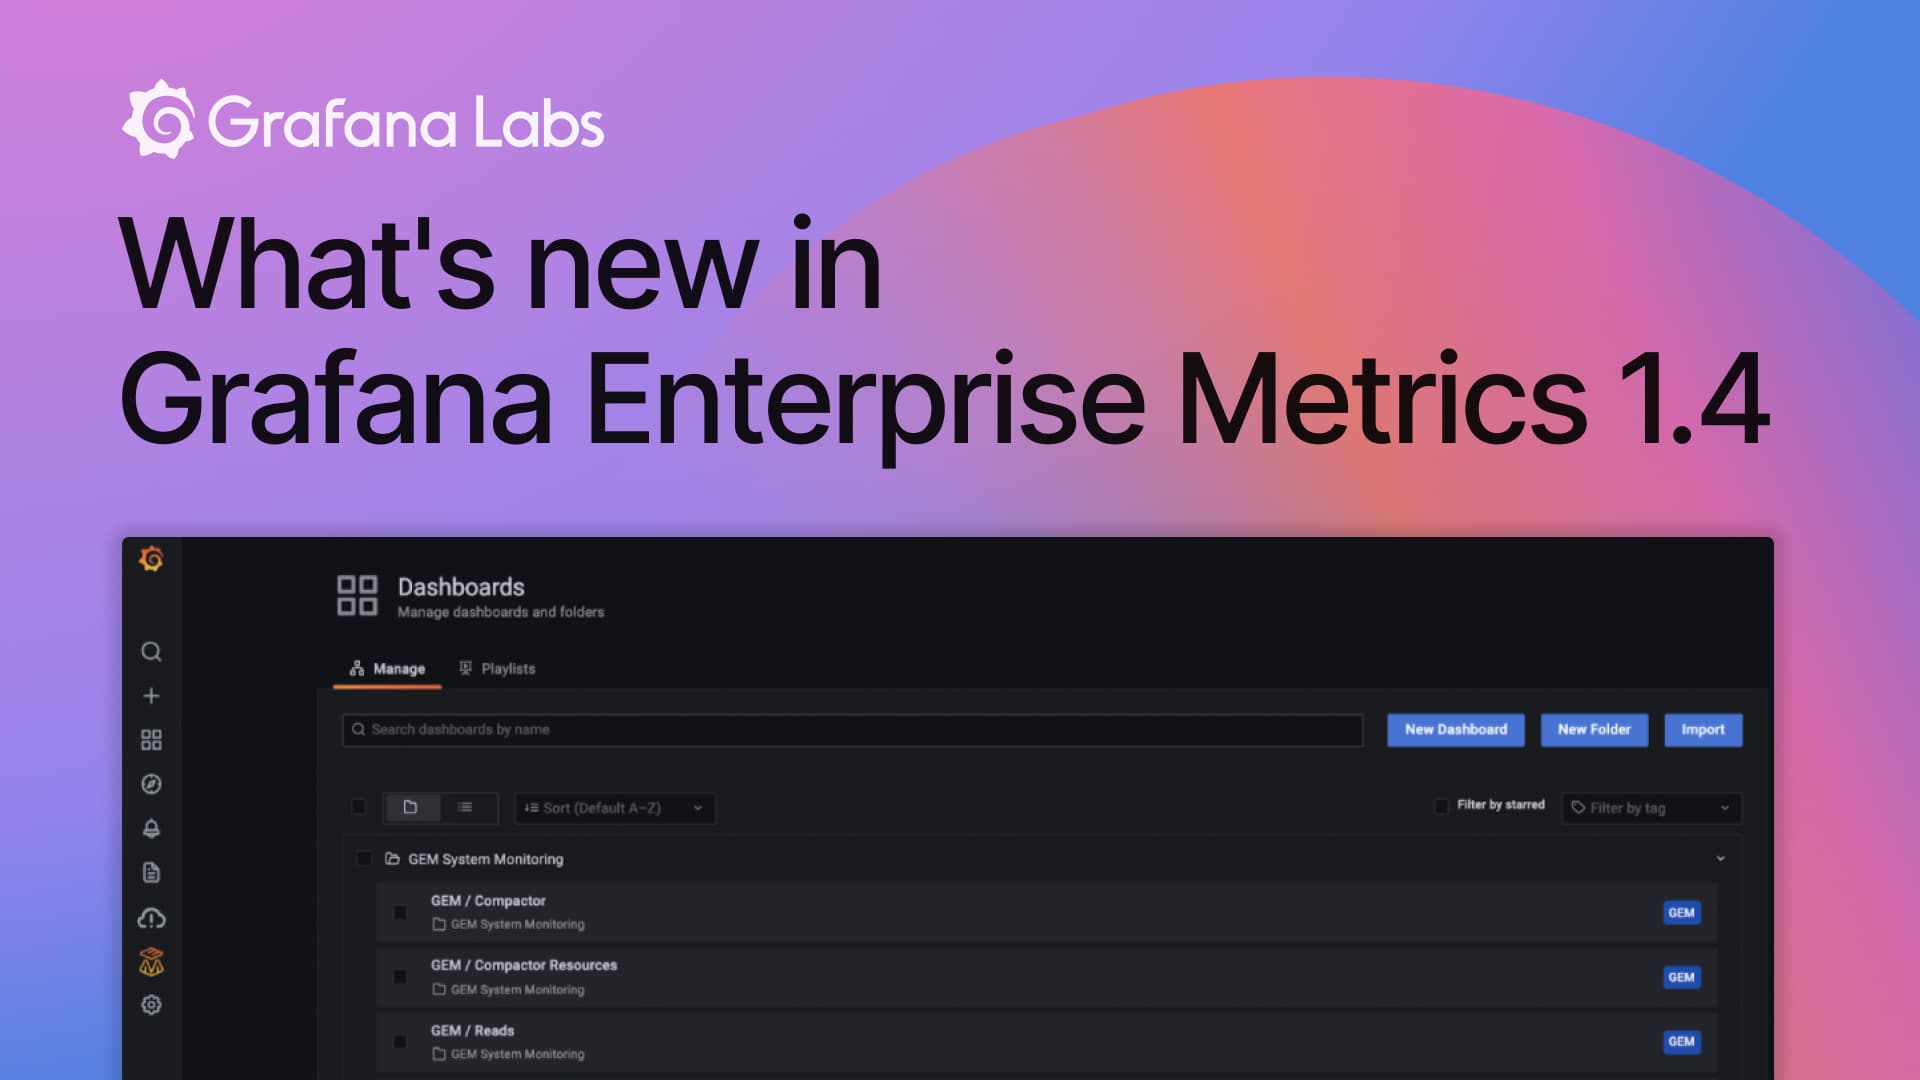
What’s new in Grafana Enterprise Metrics 1.4: Cross-cluster query federation and self-monitoringGrafana Enterprise MetricsPrometheus
How Salesforce manages service health at scale with Grafana and PrometheusAlertingDashboardPrometheus
Take Grafana Labs' 5th annual Observability SurveyThe Observability Survey is your chance to weigh in on the pressing issues facing observability leaders and practitioners today. Take it today and enter for a chance to win special Grafana swag.Observability
Grafana Labs named a Leader again in the 2026 Gartner® Magic Quadrant™ for Observability PlatformsObservabilityGrafana Cloud
Coverage-first or cost-first: two ways to automatically apply Adaptive Metrics' recommendations Adaptive TelemetryAdaptive MetricsGrafana CloudCost management
Manage your OpenTelemetry Collectors with Fleet Management in Grafana CloudFleet ManagementGrafana AlloyGrafana Cloud
Manage synthetic checks at scale: Introducing folders in Grafana Cloud Synthetic MonitoringSynthetic monitoringGrafana Cloud