Meet the Grafana Labs team: Jacqui Jeanis, account executive for Grafana EnterpriseGrafana EnterpriseTeam
Pro tips for making the most of your Datadog metrics in Grafana with the enterprise pluginGrafana EnterprisePlugins
Loki quick tip: How to create a Grafana dashboard for searching logs using Loki and PrometheusLokiPrometheus
How a production outage in Grafana Cloud’s Hosted Prometheus service was caused by a bad etcd client setupPrometheus
The view from the field: Top 4 reasons customers buy Grafana Cloud and EnterpriseGrafana CloudGrafana Enterprise
Meet the Grafana Labs team: Matt Mendick, an engineering director managing Prometheus, Loki, and Cortex developersPrometheusTeam
Cortex v1.0 released: The highly scalable, fast Prometheus implementation is generally available for production useMimirPrometheus
How to successfully correlate metrics, logs, and traces in GrafanaGrafanaLoggingLokiPrometheusTracing
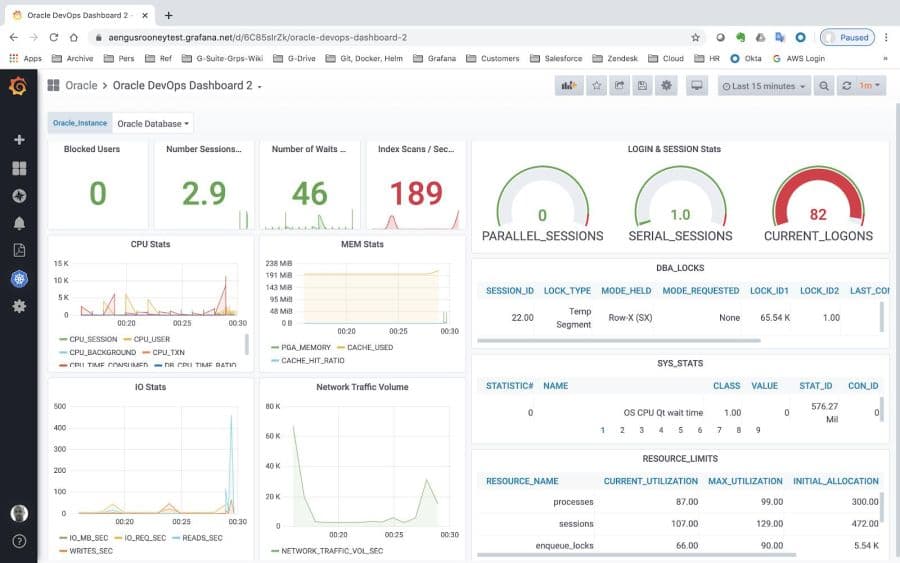
How to pull Oracle data and stats directly into Grafana dashboards with the Oracle Enterprise pluginGrafana EnterprisePlugins
Take Grafana Labs' 5th annual Observability SurveyThe Observability Survey is your chance to weigh in on the pressing issues facing observability leaders and practitioners today. Take it today and enter for a chance to win special Grafana swag.Observability
Grafana Labs named a Leader again in the 2026 Gartner® Magic Quadrant™ for Observability PlatformsObservabilityGrafana Cloud
Coverage-first or cost-first: two ways to automatically apply Adaptive Metrics' recommendations Adaptive TelemetryAdaptive MetricsGrafana CloudCost management
Manage your OpenTelemetry Collectors with Fleet Management in Grafana CloudFleet ManagementGrafana AlloyGrafana Cloud
Manage synthetic checks at scale: Introducing folders in Grafana Cloud Synthetic MonitoringSynthetic monitoringGrafana Cloud