
Parseable Datasource for Grafana
This data source plugin allows you to query, search and visualize telemetry data stored in Parseable server.
Pre-requisites
Parseable server setup and receiving telemetry data from your application. Read more on Parseable documentation.
Installation
Install the plugin using the Grafana CLI, using the command
grafana-cli plugins install parseable-datasource. Then restart Grafana. Alternatively, you can install the plugin from your Grafana instance (Configuration > Data sources > Add Data source).Add Parseable as a data source at the data source configuration page.
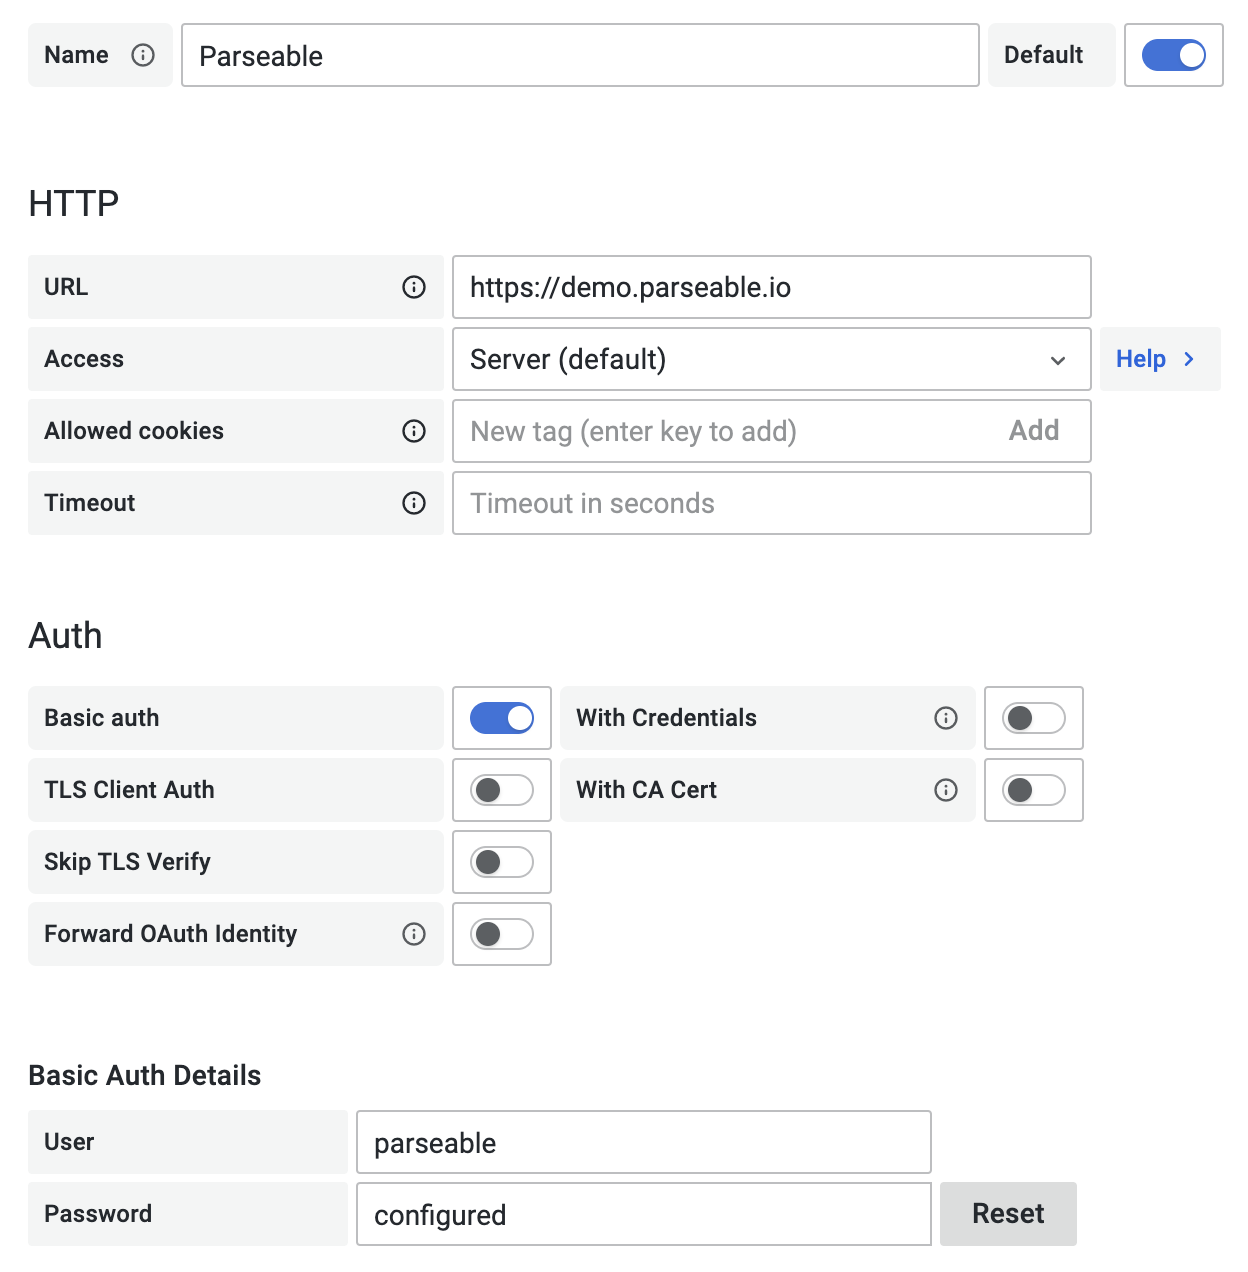
Configure the data source specifying URL and port like https://demo.parseable.com:443. Parseable supports basic auth currently, so toggle the "Basic Auth" option under "Auth" section and enter the username and password under "Basic Auth Details" section. For Parseable demo server use
parseableas both, username and password.Push the
Save and Testbutton, if there is an error message, check the credentials and connection.
Usage
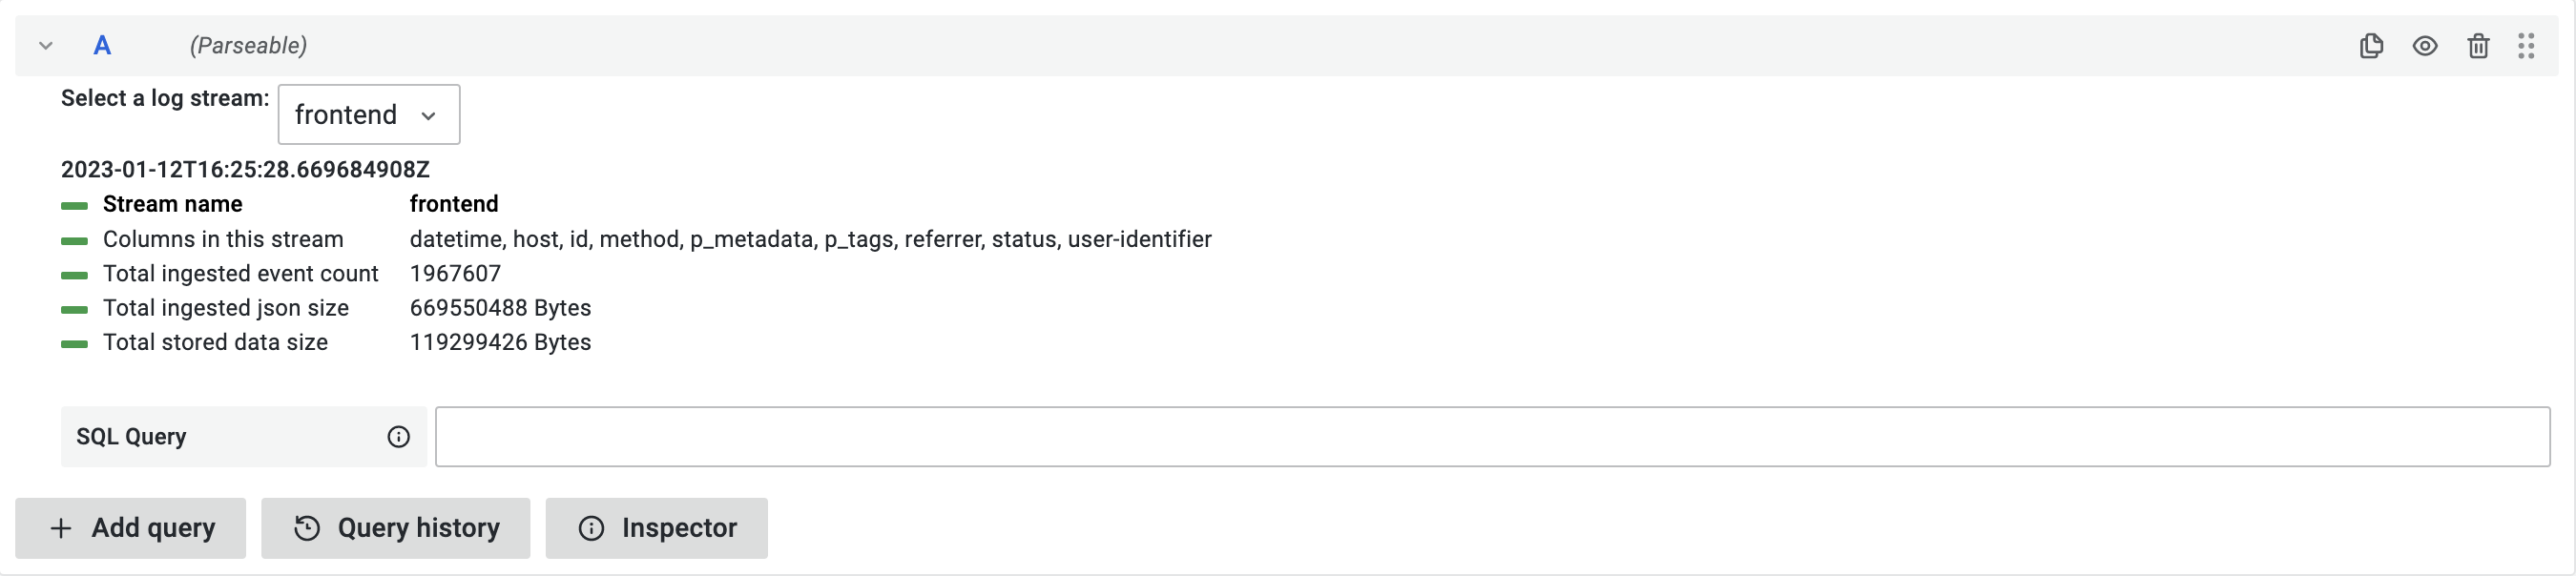
Once the plugin is configured with correct Parseable server instance. You can start using it to query, search and visualize telemetry data stored in Parseable server. You can use the query editor to write your own queries.
Importing Dashboards
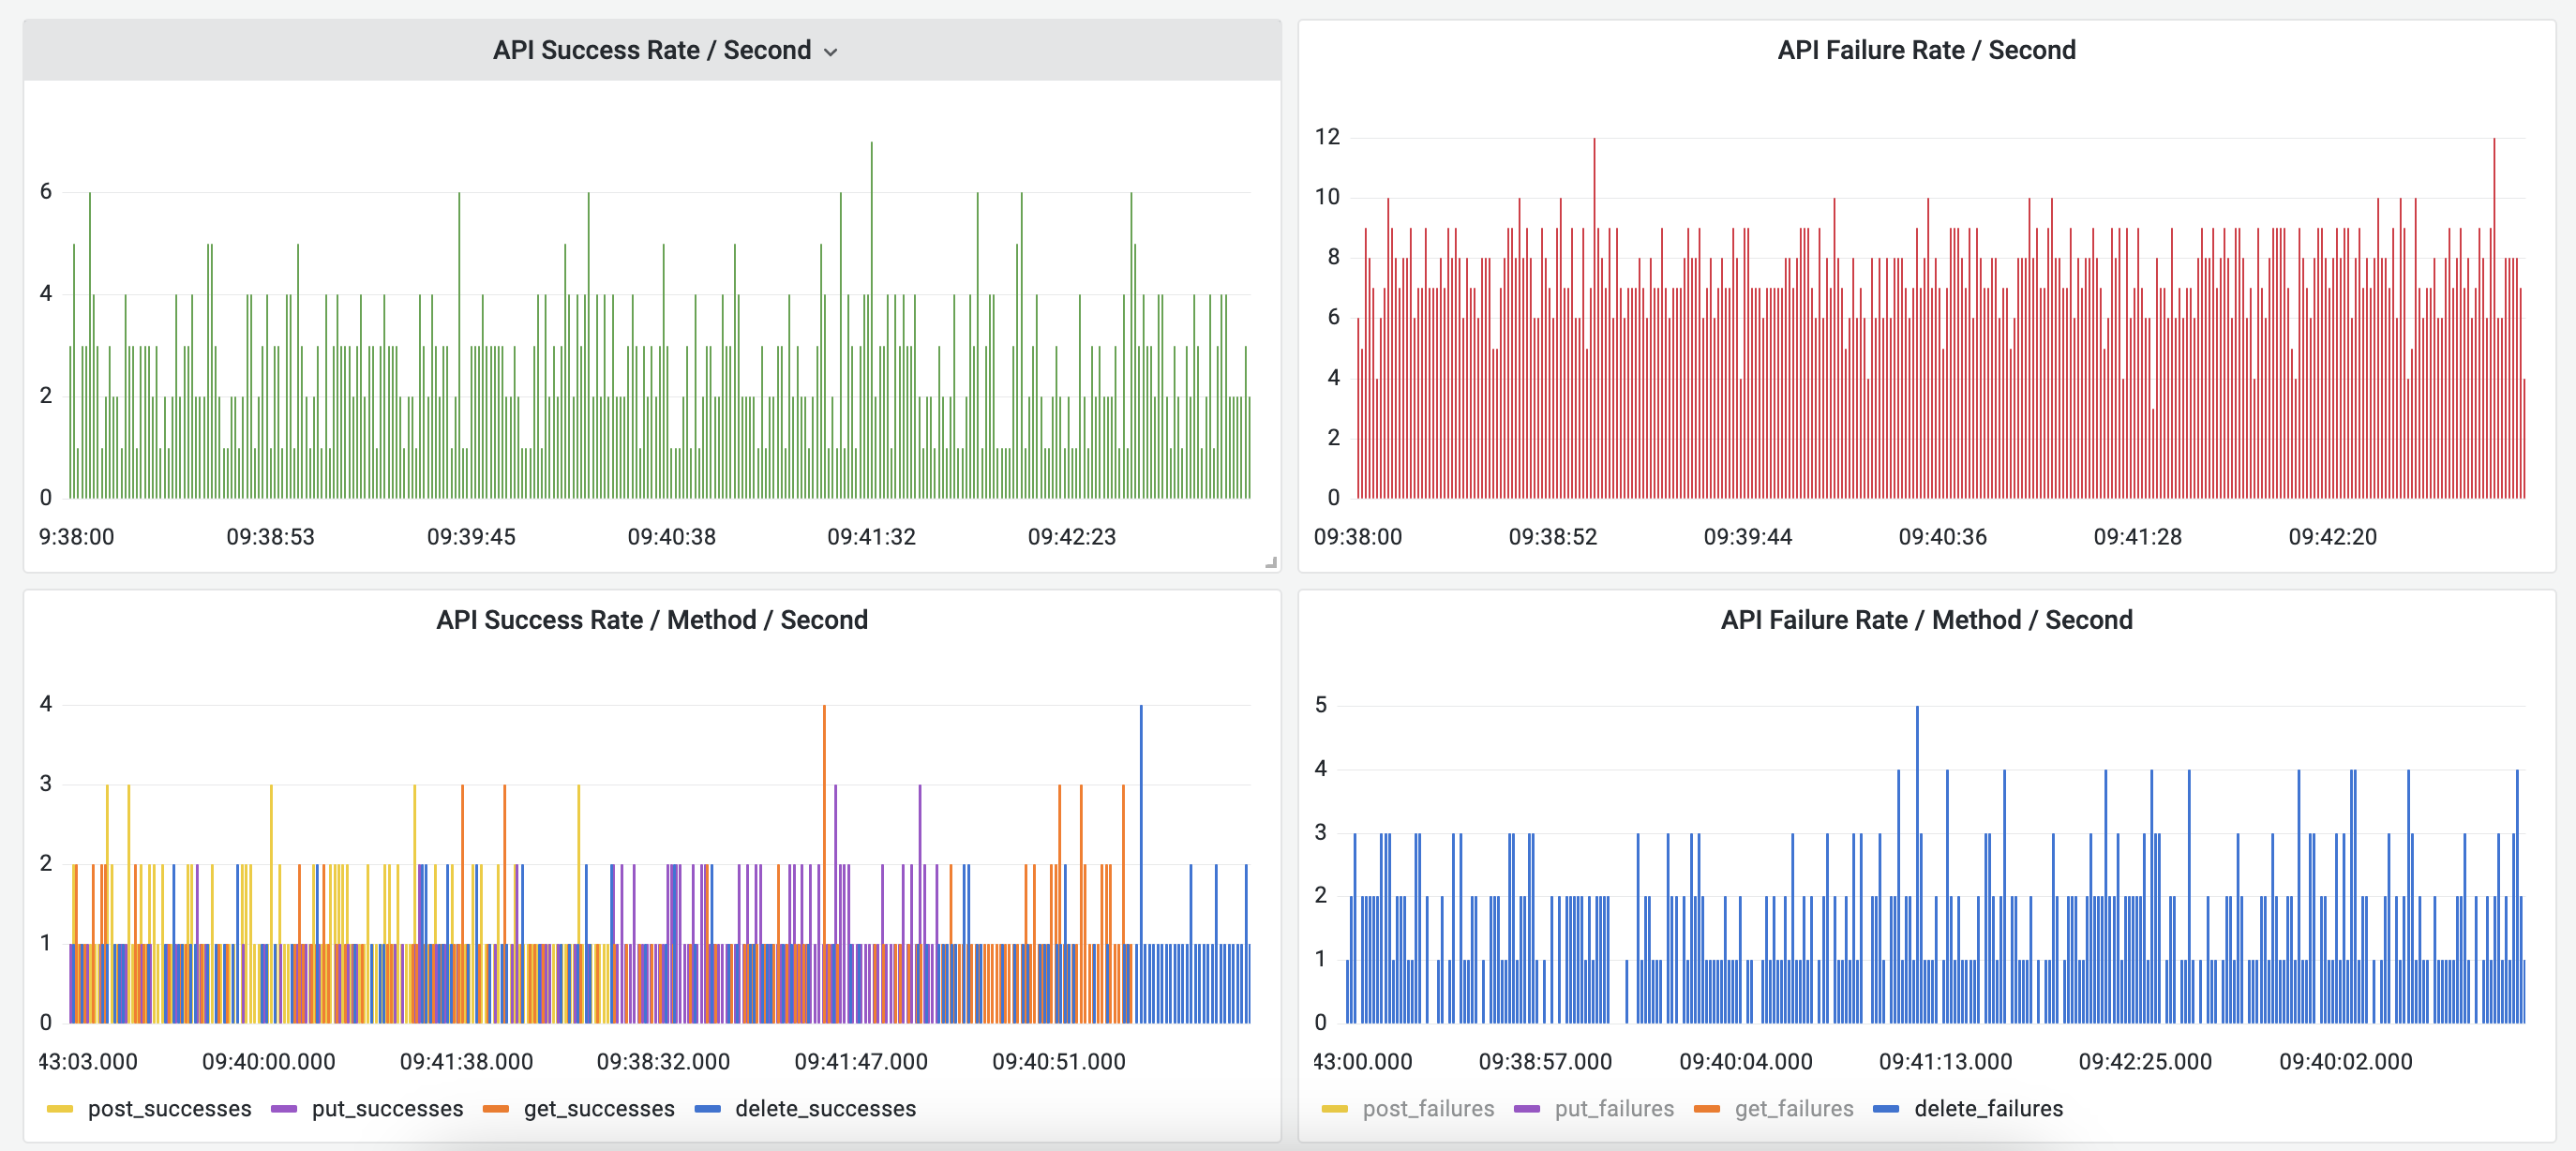
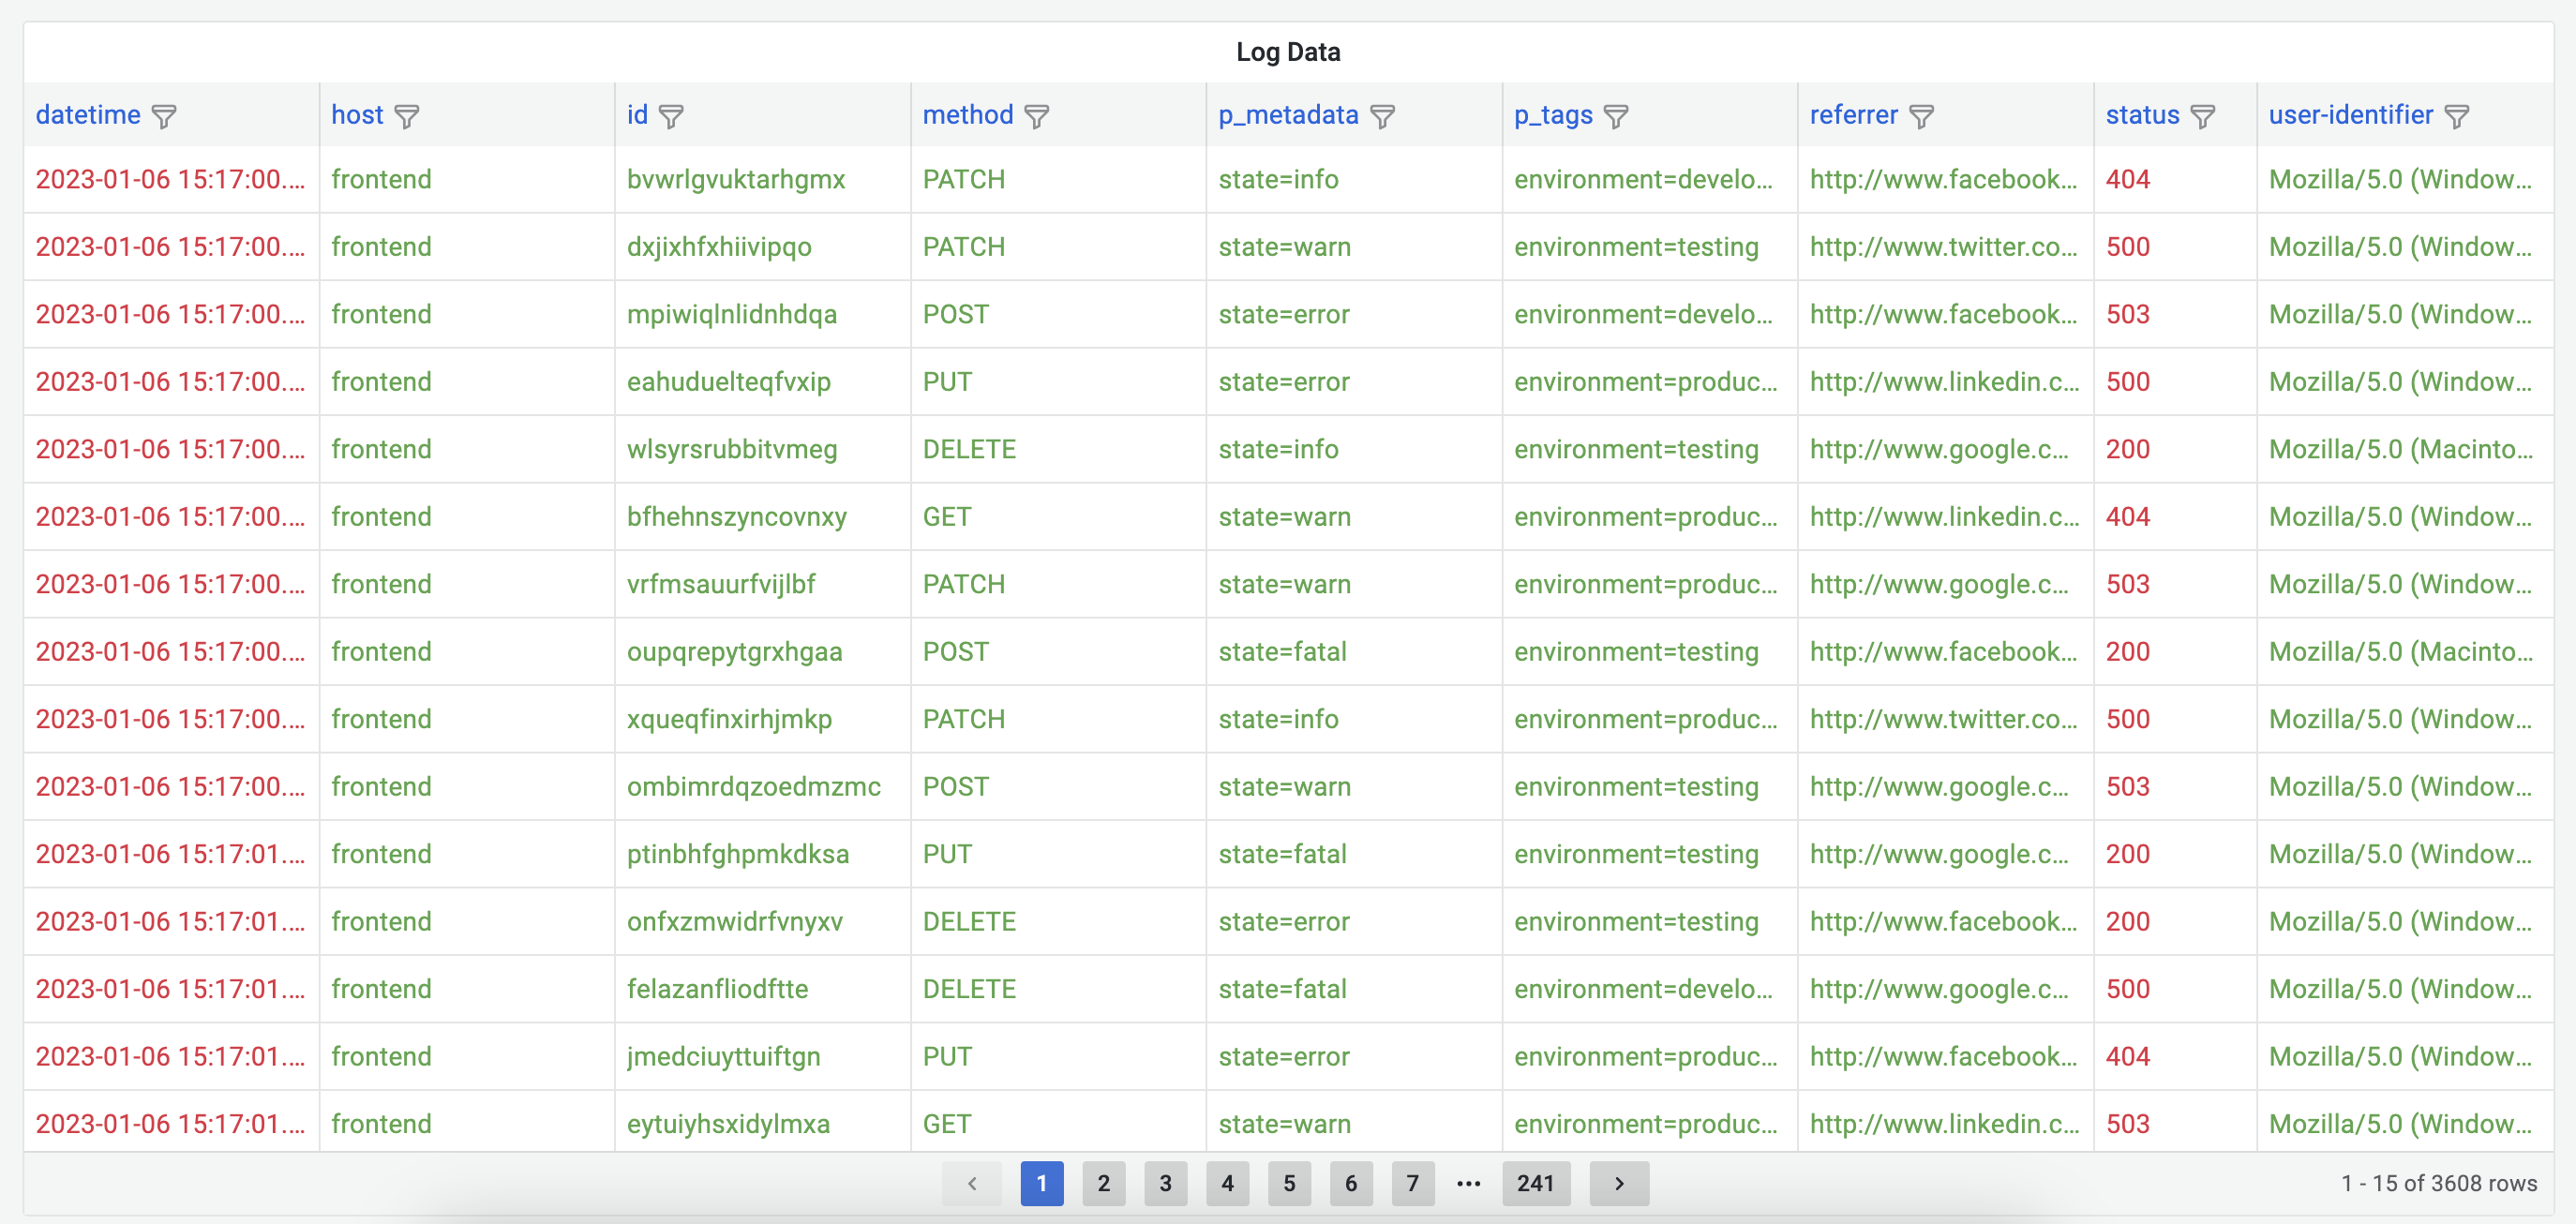
This plugin has a a pre-made dashboard called "Parseable Demo Data". You can find it by navigating to the data sources configuration page, selecting the Parseable data source and clicking on the Dashboards tab.
This dashboard is aimed at visualizing the telemetry data stored in the Parseable demo server. You can use it as a starting point for your own dashboards. To use this dashboard, you will need to configure the data source with the Parseable demo server URL https://demo.parseable.com and credentials admin, admin.
Screenshots
Grafana Cloud
Connect any plugin in Grafana Cloud.
- 150+ data source integrations
- Grafana Assistant - AI that correlates your data, builds queries, and answers questions
- 10k Prometheus metrics + 50 GB logs, traces, and profiles on the free tier
- ...and more
Insights
- Adoption
Running on 3 active Grafana instances.
- Activity
Last updated 5 Jun 2026.
1 release in the past year.
- Queries
1 total queries served across all Grafana Cloud instances.
- Version
- 2.0.0
- Dependencies
- Grafana >=10.0.0
- Developer
- parseable
Grafana Cloud
Connect any plugin in Grafana Cloud.
- 150+ data source integrations
- Grafana Assistant - AI that correlates your data, builds queries, and answers questions
- 10k Prometheus metrics + 50 GB logs, traces, and profiles on the free tier
- ...and more