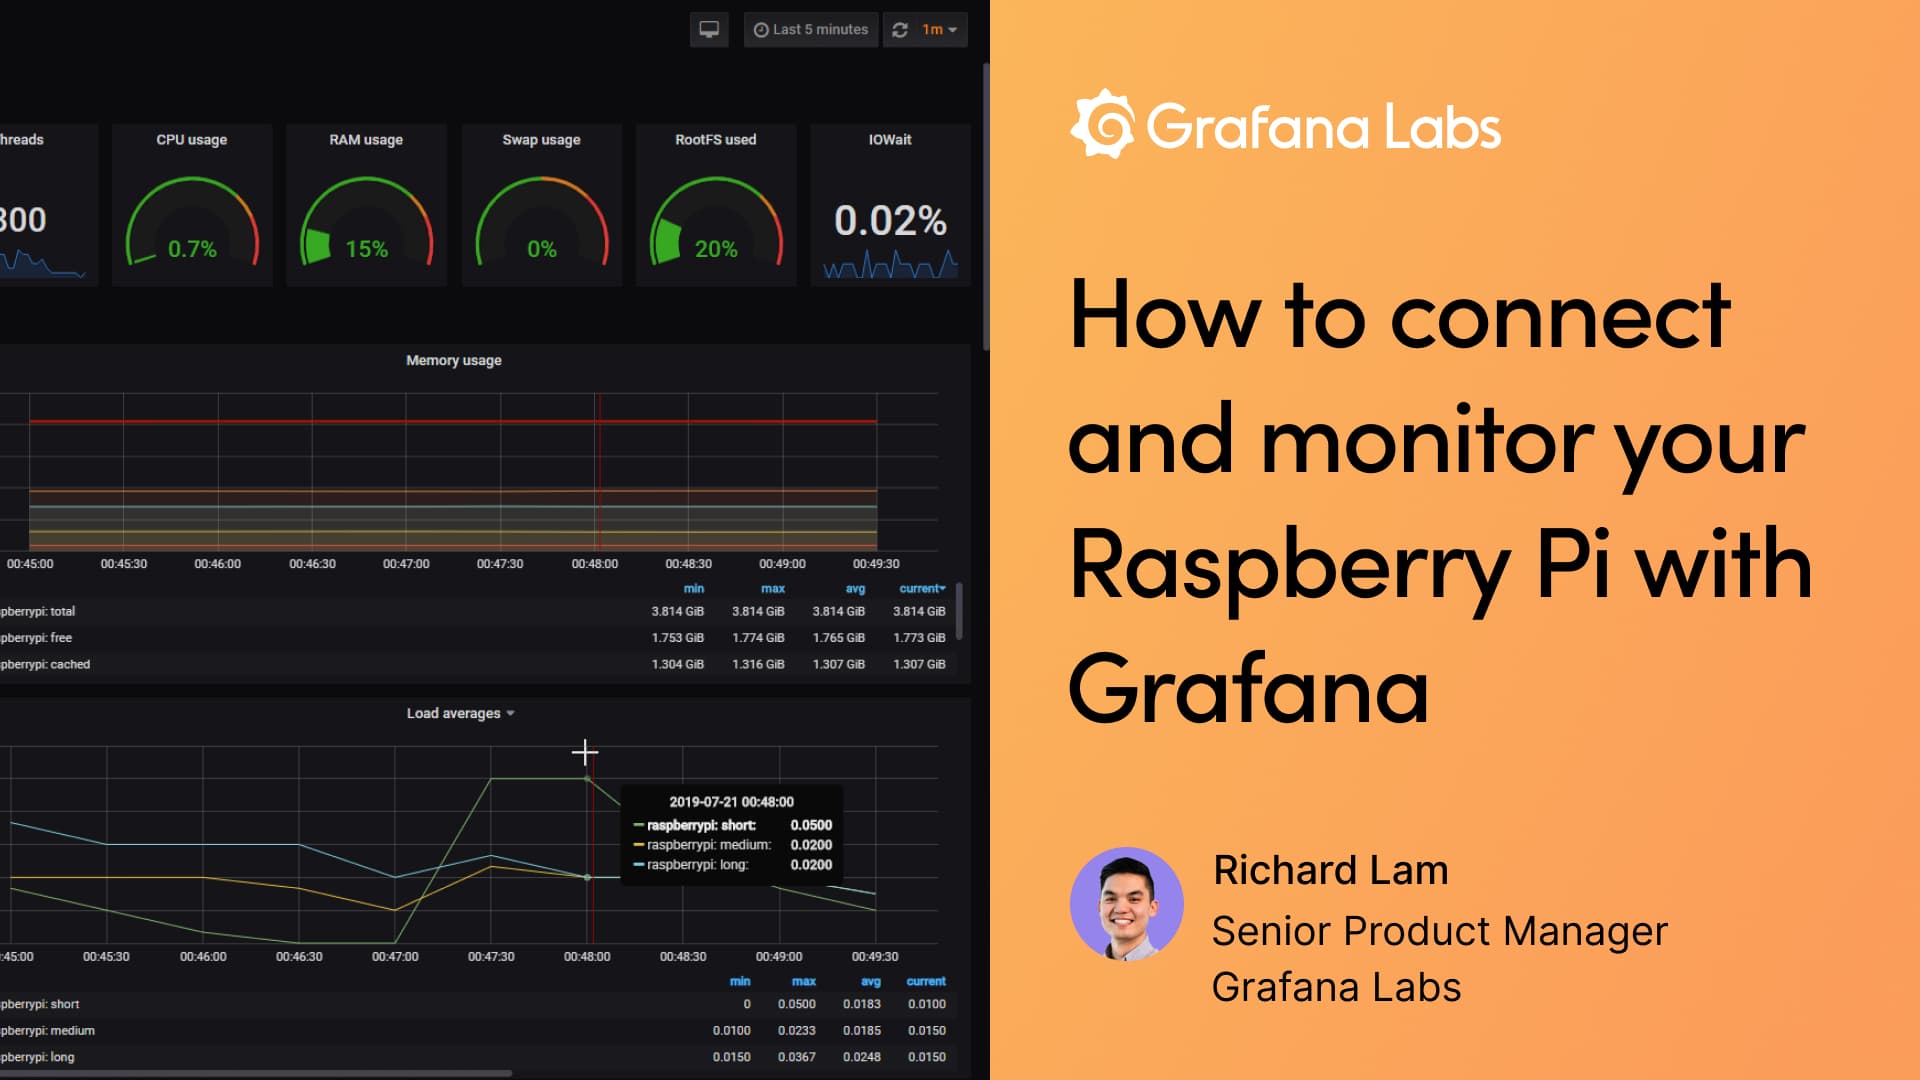
Learn how to monitor your Raspberry Pi with Grafana Cloud during this week’s live webinarGrafana CloudGrafanaMonitoringRaspberry pi
Using Telegraf plugins to visualize industrial IoT data with the Grafana Cloud Hosted Prometheus serviceGrafana CloudPrometheusIoT
Meet the Grafana Labs team: Natalia Bernarte, an engineering manager for the Grafana frontend platform teamTeam
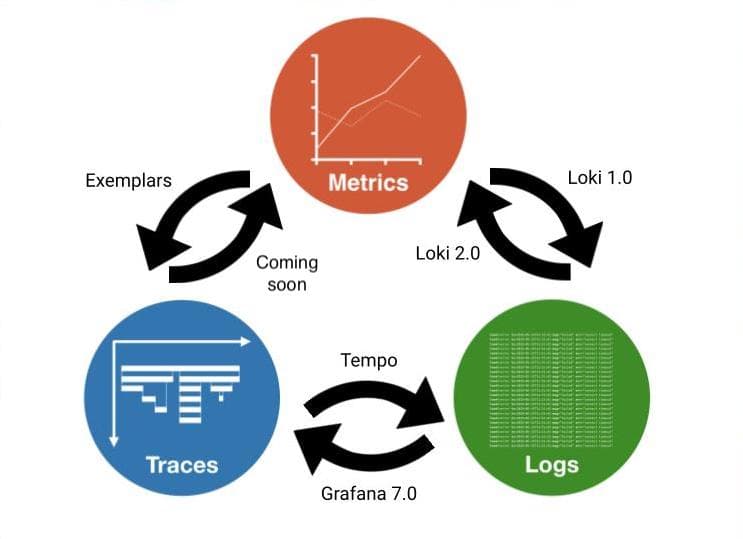
Intro to exemplars, which enable Grafana Tempo’s distributed tracing at massive scaleTempoPrometheusTracing
Want to visualize software development insights with Grafana? With our new Jira Enterprise plugin, you can!Grafana EnterprisePluginsGrafana
How we’re graduating Grafana Agent experiments into the official Prometheus projectPrometheusGrafana Agent
How we responded to a 2-hour outage in our Grafana Cloud Hosted Prometheus serviceGrafana CloudPrometheus
Grafana 7.5 released: Loki alerting and label browser for logs, next-generation pie chart, and more!GrafanaLokiTempo
What’s new in Grafana Cloud for March 2021: improvements to alerting, synthetic monitoring, and moreGrafana CloudGrafana AgentAlertingSynthetic monitoring
Meet the Grafana Labs team: Software engineer Vicky Lee, who builds Enterprise plugins for GrafanaTeamGrafana EnterprisePlugins
Grafana 6.7.6, 7.3.10, and 7.4.5 released with important security fixes for Grafana EnterpriseGrafanaGrafana Enterprise
Why implementing Grafana Enterprise was a bright idea for U.K. energy supplier UtilitaGrafana EnterprisePluginsOracle
What’s new in Grafana Enterprise Metrics for scaling Prometheus: enhanced access control and a compactor that supports 650 million active series and beyondPrometheusMimirGrafana Enterprise Metrics
Meet the Grafana Labs team: Uche Obasi, a software engineer who builds frontend Grafana featuresTeamGrafana
Grafana Loki 2.2 released: Multi-line logs, crash resiliency, and performance improvementsLokiLogging
Take Grafana Labs' 5th annual Observability SurveyThe Observability Survey is your chance to weigh in on the pressing issues facing observability leaders and practitioners today. Take it today and enter for a chance to win special Grafana swag.Observability
Grafana Labs named a Leader again in the 2026 Gartner® Magic Quadrant™ for Observability PlatformsObservabilityGrafana Cloud
Coverage-first or cost-first: two ways to automatically apply Adaptive Metrics' recommendations Adaptive TelemetryAdaptive MetricsGrafana CloudCost management
Manage your OpenTelemetry Collectors with Fleet Management in Grafana CloudFleet ManagementGrafana AlloyGrafana Cloud
Manage synthetic checks at scale: Introducing folders in Grafana Cloud Synthetic MonitoringSynthetic monitoringGrafana Cloud