The Splunk plugin for Grafana now supports data links for jumping directly from logs to tracesGrafana EnterprisePluginsTempoJaegerTracingLogging
How the FourthDown NFL play-by-play API measures its performance with Prometheus, Jaeger, and Grafana CloudGrafana CloudGrafanaPrometheusJaegerMonitoring
Grafana 7.4 released: Next-generation graph panel with 30 fps live streaming, Prometheus exemplar support, trace to logs, and moreGrafanaPrometheusTracingLogging
Auto-instrumenting a Java Spring Boot application for traces and logs using OpenTelemetry and Grafana TempoTempoOpenTelemetry
Real-time monitoring of Formula 1 telemetry data on Kubernetes with Grafana, Apache Kafka, and StrimziGrafanaMonitoringKubernetesKafka
Farewell, worldPing. Hello, Grafana Cloud synthetic monitoring!Grafana CloudWorldPingSynthetic monitoring
How we live-migrated massive Cortex clusters to blocks storage with zero impact to Grafana Cloud customersGrafana CloudMimirPrometheusMigration
How to get started quickly with the new synthetic monitoring feature in Grafana CloudGrafana CloudGrafanaWorldPingSynthetic monitoring
How to connect and monitor your Raspberry Pi with Grafana CloudGrafana CloudGrafanaMonitoringRaspberry pi
A beginner’s guide to distributed tracing and how it can increase an application’s performanceTracingTempoJaegerGrafanaObservability
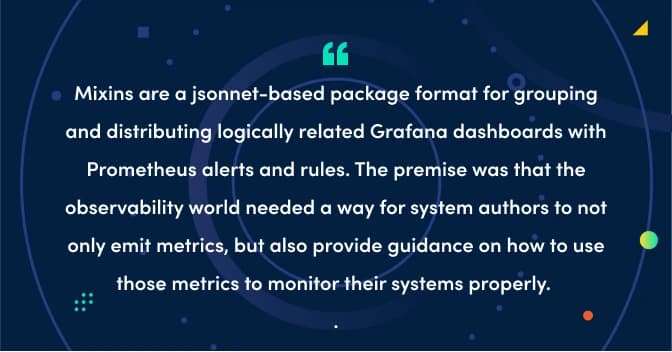
How Prometheus monitoring mixins can make effective observability strategies accessible to allGrafanaObservabilityPrometheus
How to get started quickly with metrics, logs, and traces using Grafana Cloud integrationsGrafana CloudGrafanaPrometheus
The new Grafana Cloud: the only composable observability stack for metrics, logs, and traces, now with free and paid plans to suit every use caseGrafana CloudGrafanaLokiObservabilityPrometheusTempo
Take Grafana Labs' 5th annual Observability SurveyThe Observability Survey is your chance to weigh in on the pressing issues facing observability leaders and practitioners today. Take it today and enter for a chance to win special Grafana swag.Observability
Grafana Labs named a Leader again in the 2026 Gartner® Magic Quadrant™ for Observability PlatformsObservabilityGrafana Cloud
Coverage-first or cost-first: two ways to automatically apply Adaptive Metrics' recommendations Adaptive TelemetryAdaptive MetricsGrafana CloudCost management
Manage your OpenTelemetry Collectors with Fleet Management in Grafana CloudFleet ManagementGrafana AlloyGrafana Cloud
Manage synthetic checks at scale: Introducing folders in Grafana Cloud Synthetic MonitoringSynthetic monitoringGrafana Cloud