Interested in Grafana, Prometheus, Loki, and more? The first-ever Grafana ObservabilityCON is coming October 26-29EventsGrafanaLokiPrometheus
Meet the Grafana Labs team: Heds Simons, a Grafana, Loki, and Prometheus power user turned solutions engineerTeam
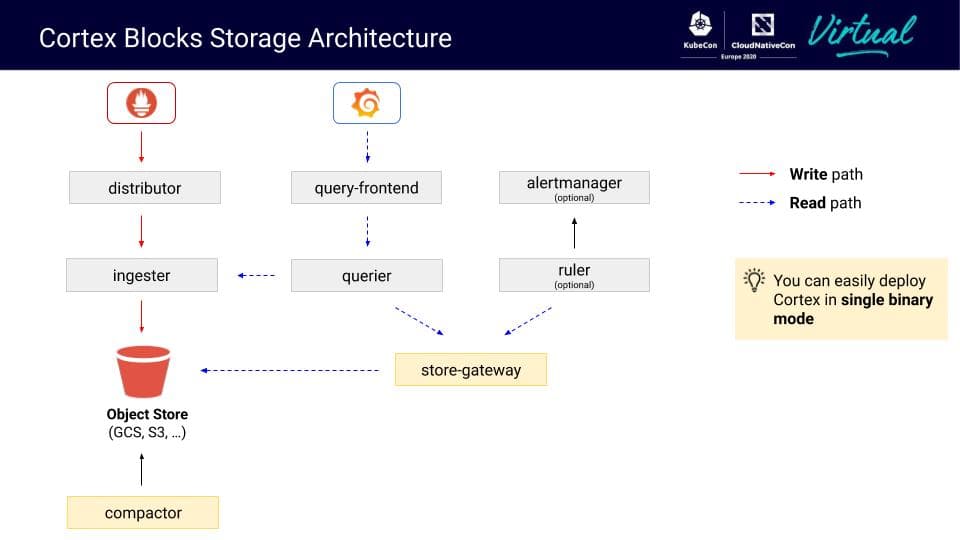
\[KubeCon + CloudNativeCon EU recap\] Getting some Thanos into Cortex while scaling PrometheusMimirPrometheus
Introducing the Grafana Accelerator Program, one of the investments we’re making in the community after raising \$50 millionCommunity
KubeCon + CloudNativeCon preview: Grafana Labs team members talk about Prometheus, Cortex, and OpenMetricsEventsPrometheus
Loki 1.6.0 released: Metric query performance up to 10x faster, push logs from any client to Promtail, query language and LogCLI enhancements, and more!Loki
Take Grafana Labs' 5th annual Observability SurveyThe Observability Survey is your chance to weigh in on the pressing issues facing observability leaders and practitioners today. Take it today and enter for a chance to win special Grafana swag.Observability
Grafana Labs named a Leader again in the 2026 Gartner® Magic Quadrant™ for Observability PlatformsObservabilityGrafana Cloud
Coverage-first or cost-first: two ways to automatically apply Adaptive Metrics' recommendations Adaptive TelemetryAdaptive MetricsGrafana CloudCost management
Manage your OpenTelemetry Collectors with Fleet Management in Grafana CloudFleet ManagementGrafana AlloyGrafana Cloud
Manage synthetic checks at scale: Introducing folders in Grafana Cloud Synthetic MonitoringSynthetic monitoringGrafana Cloud