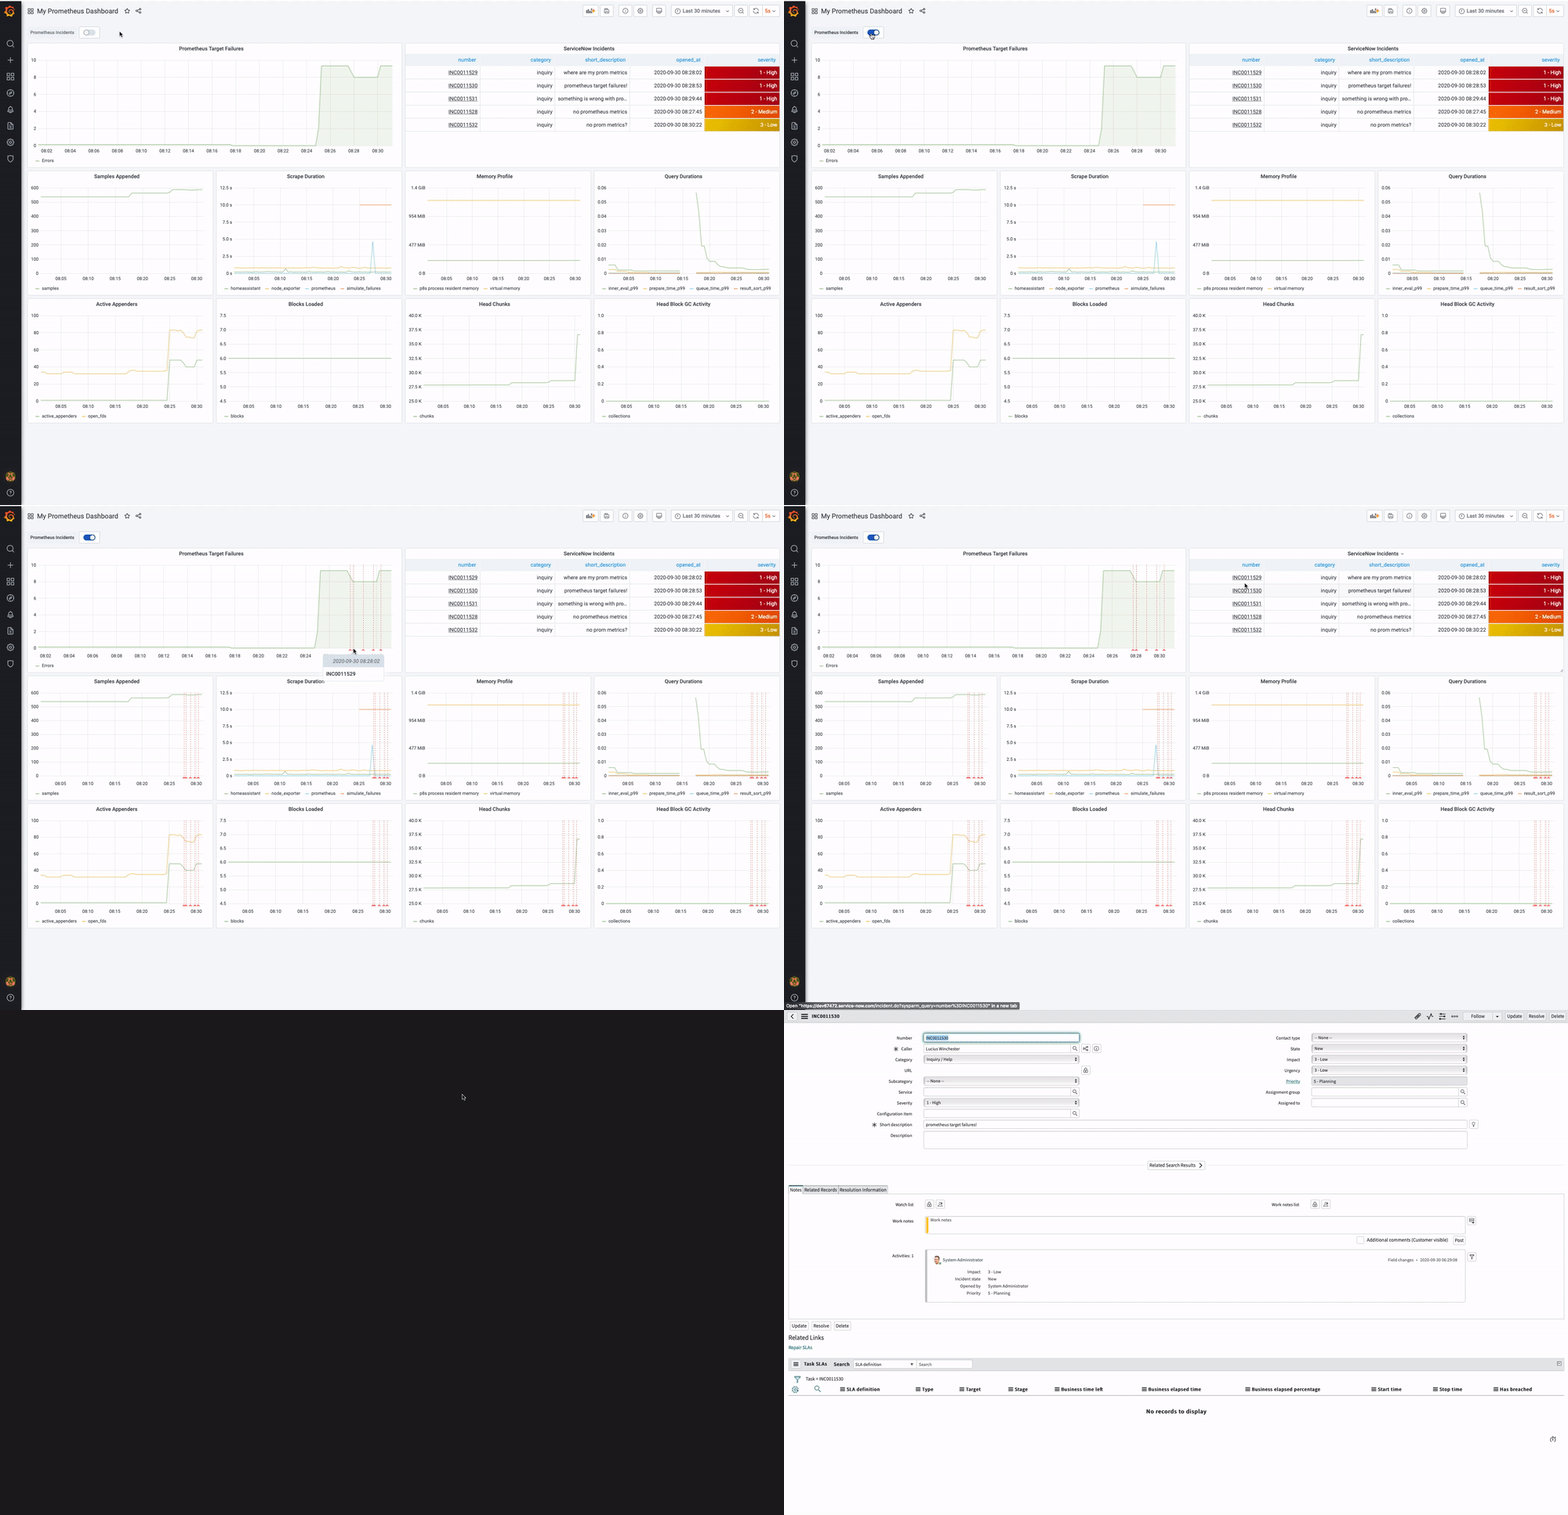
New features in the ServiceNow plugin for Grafana: table query, annotations, and more!Grafana EnterpriseGrafanaPluginsGrafana Cloud
September observability roundup: Run Prometheus-as-a-Service with the new Grafana Metrics Enterprise, ObservabilityCON, and moreGrafana CloudGrafanaPrometheus
Introducing Grafana Metrics Enterprise, a Prometheus-as-a-service solution for enterprise scalePrometheusGrafana Enterprise Metrics
How we’re making it easier to use the Loki logging system with AWS Lambda and other short-lived servicesGrafanaLoki
Meet the Grafana Labs team: Suraj Nath, a software engineer working on Grafana CloudGrafana CloudTeam
All the non-technical advantages of Loki: reduce costs, streamline operations, build better teamsLoki
Take Grafana Labs' 5th annual Observability SurveyThe Observability Survey is your chance to weigh in on the pressing issues facing observability leaders and practitioners today. Take it today and enter for a chance to win special Grafana swag.Observability
Grafana Labs named a Leader again in the 2026 Gartner® Magic Quadrant™ for Observability PlatformsObservabilityGrafana Cloud
Coverage-first or cost-first: two ways to automatically apply Adaptive Metrics' recommendations Adaptive TelemetryAdaptive MetricsGrafana CloudCost management
Manage your OpenTelemetry Collectors with Fleet Management in Grafana CloudFleet ManagementGrafana AlloyGrafana Cloud
Manage synthetic checks at scale: Introducing folders in Grafana Cloud Synthetic MonitoringSynthetic monitoringGrafana Cloud