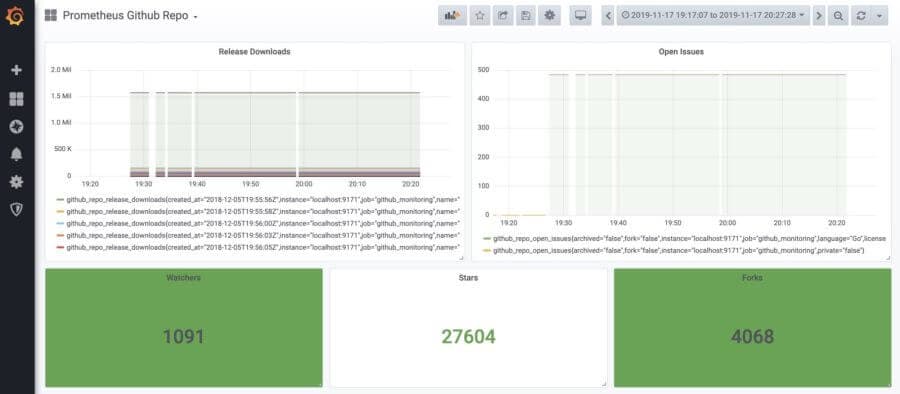
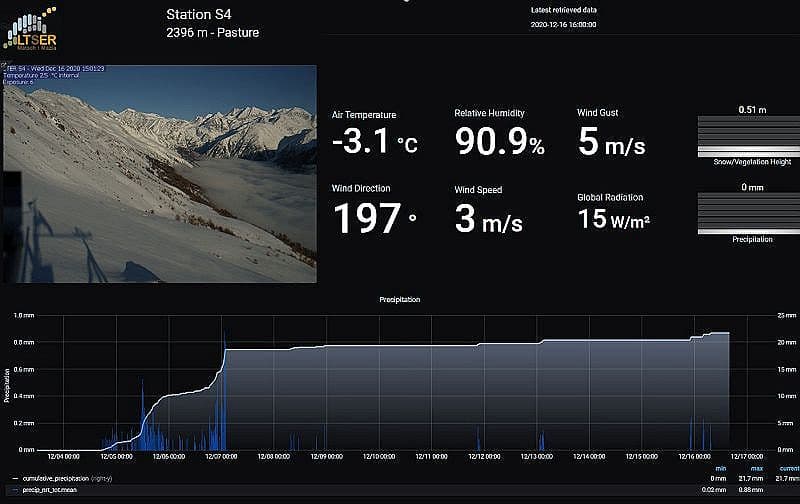
How using Grafana (and plugins) gave a jolt to Smart State Technology, a company advancing technology for energy infrastructuresGrafana
Grafana 6.7.5, 7.2.3, and 7.3.6 released with important security fix for Grafana EnterpriseGrafana EnterpriseGrafanaSecurity
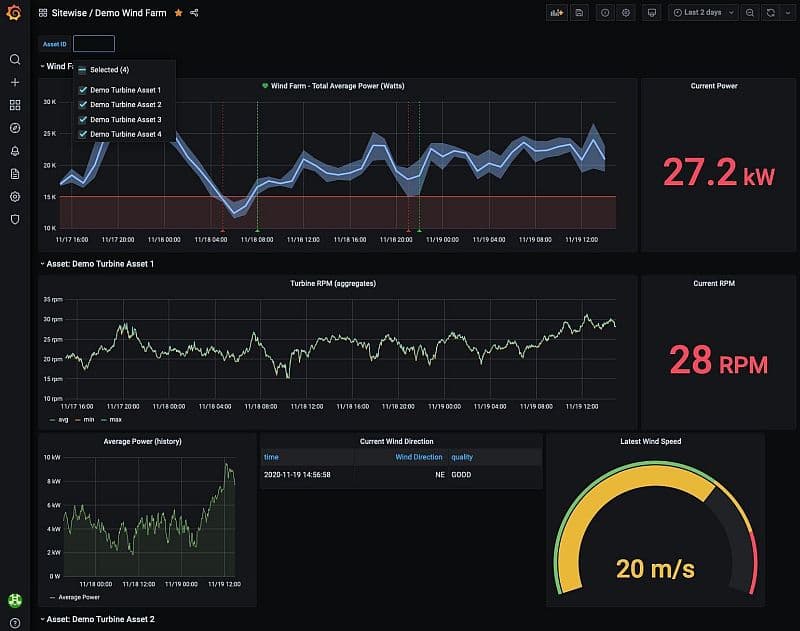
With the new AWS IoT SiteWise plugin, you can visualize and monitor your equipment data in Grafana dashboardsGrafanaPluginsIoT
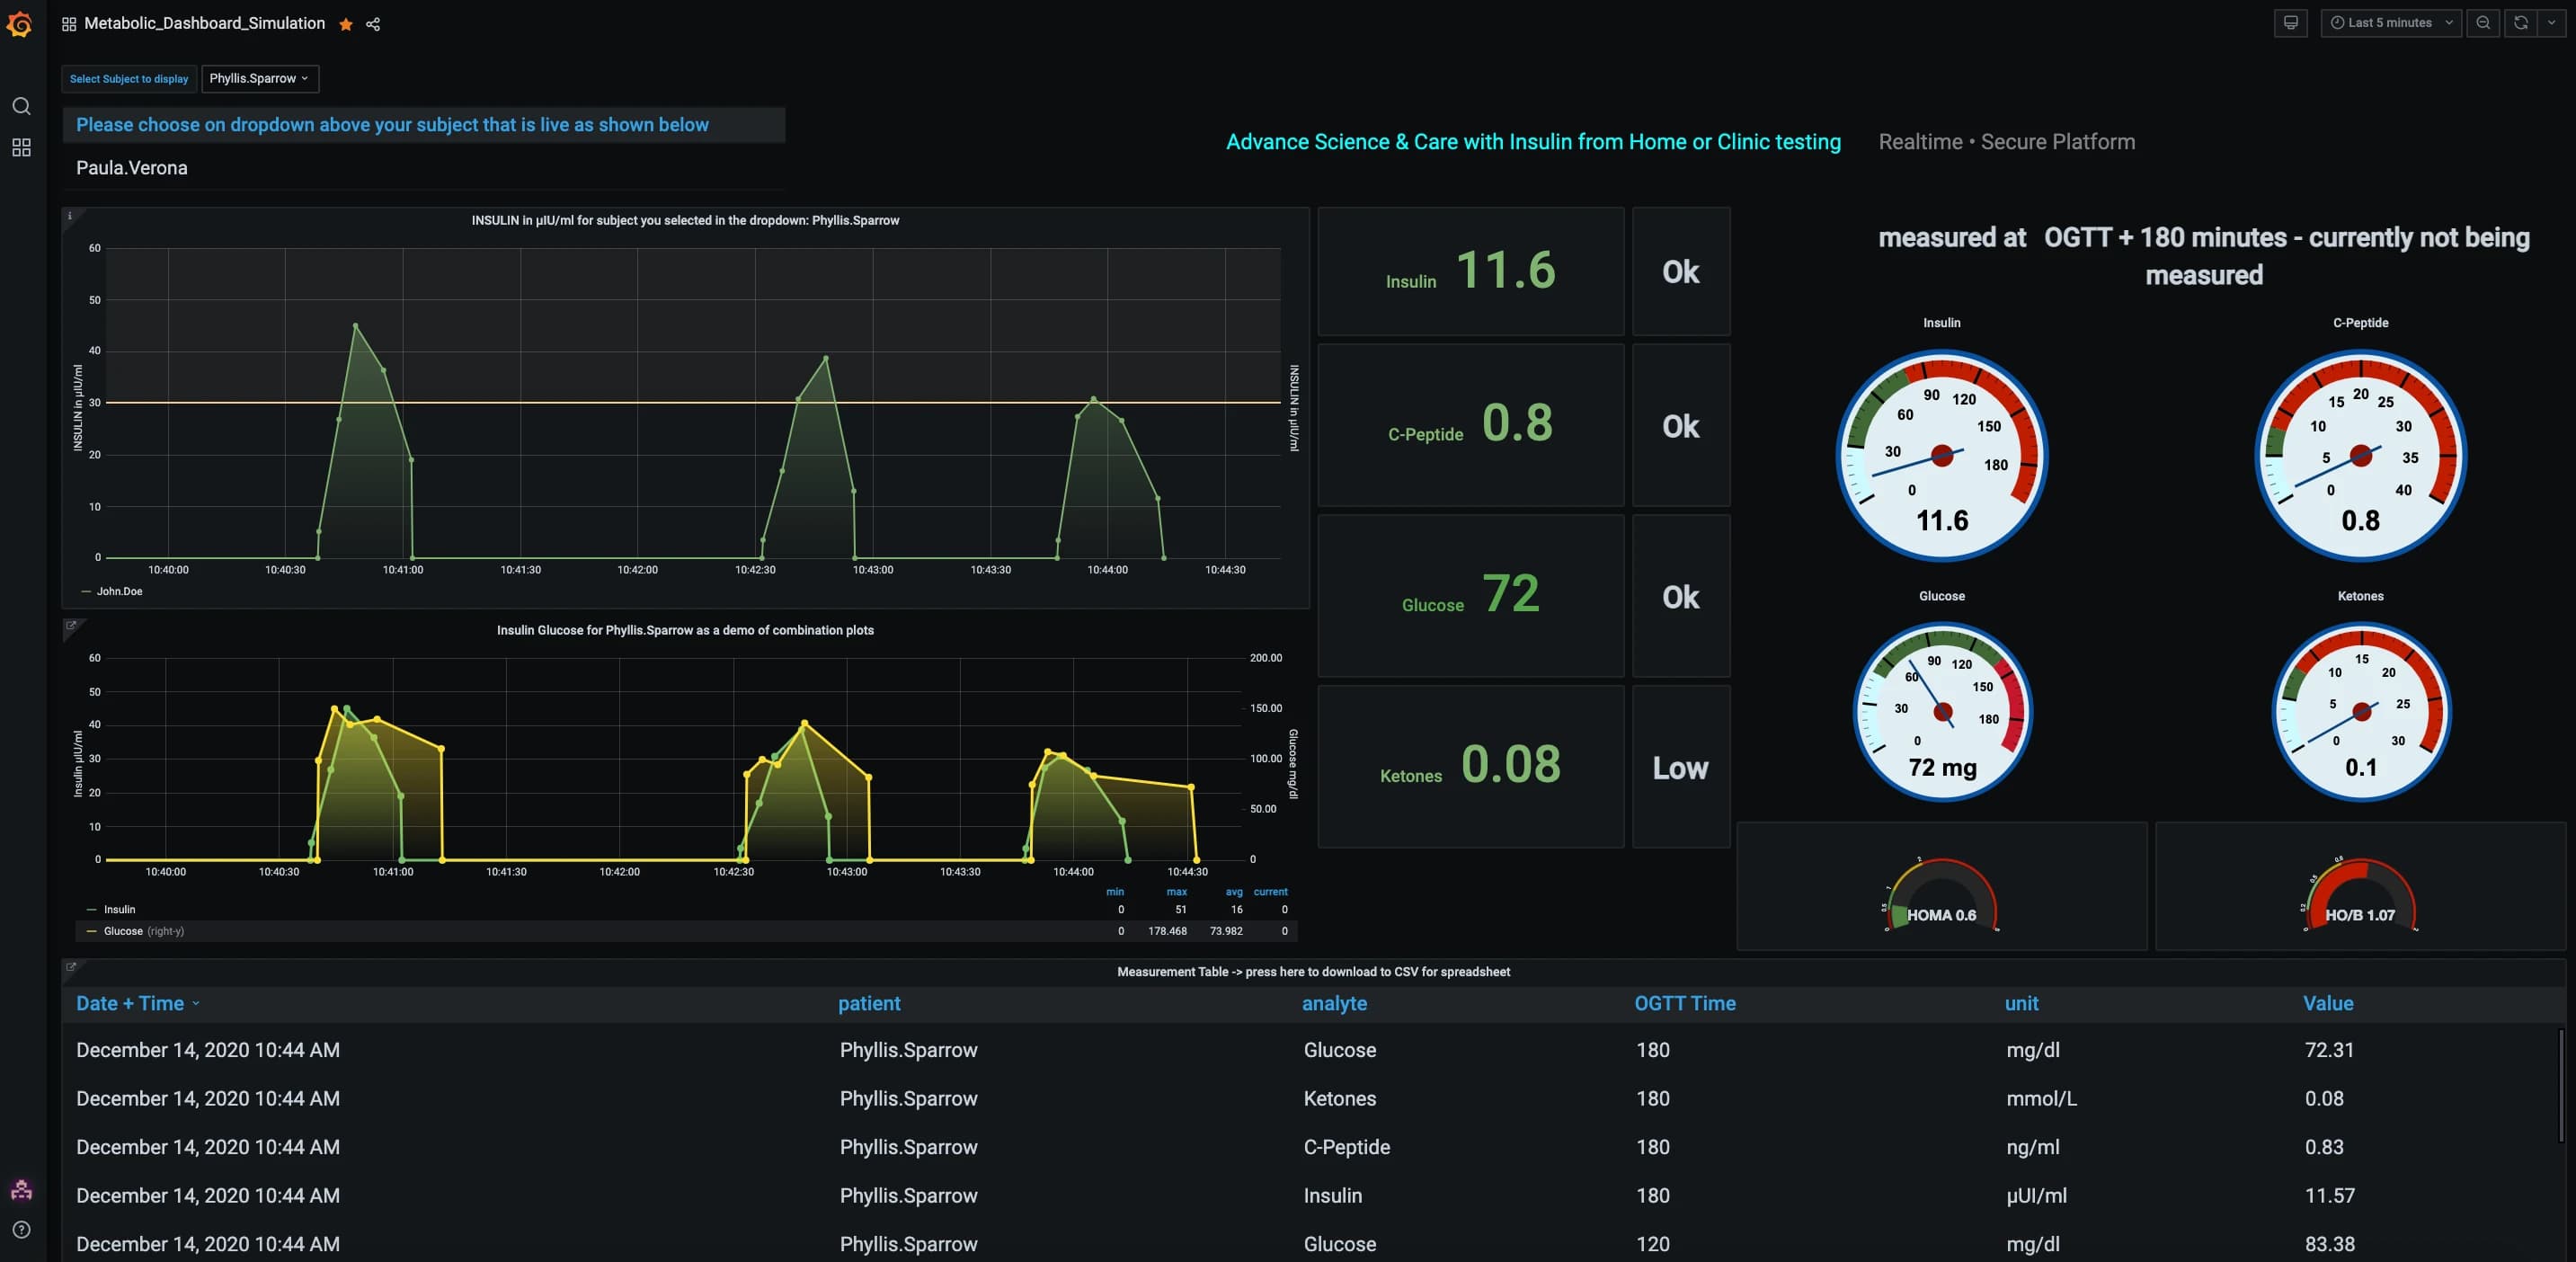
How Grafana is helping the DIFFERENCE Foundation visualize medical data in their fight against a global pandemicGrafana
How we’ve grown community calls for Grafana, Loki, Tempo, and Tanka this yearCommunityGrafanaLokiTankaTempoUX
Take Grafana Labs' 5th annual Observability SurveyThe Observability Survey is your chance to weigh in on the pressing issues facing observability leaders and practitioners today. Take it today and enter for a chance to win special Grafana swag.Observability
Grafana Labs named a Leader again in the 2026 Gartner® Magic Quadrant™ for Observability PlatformsObservabilityGrafana Cloud
Coverage-first or cost-first: two ways to automatically apply Adaptive Metrics' recommendations Adaptive TelemetryAdaptive MetricsGrafana CloudCost management
Manage your OpenTelemetry Collectors with Fleet Management in Grafana CloudFleet ManagementGrafana AlloyGrafana Cloud
Manage synthetic checks at scale: Introducing folders in Grafana Cloud Synthetic MonitoringSynthetic monitoringGrafana Cloud