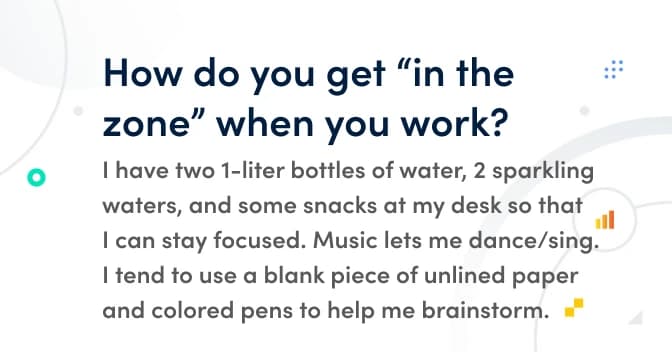
Meet the Grafana Labs team: Oana Mangiurea, a UX designer working on Grafana CloudGrafana CloudTeamUX
How we eliminated service outages from ‘certificate expired’ by setting up alerts with Grafana and PrometheusGrafanaPrometheus
The observability market is heating up, but is it more than just hype? Industry watchers weigh inObservability
KubeCon + CloudNativeCon preview: Watch our talks about Prometheus, Cortex, and moreMimirEventsPrometheus
ObservabilityCON Day 4 recap: a panel discussion on observability (and its future), the benefits of Chaos Engineering, and an observability demo showcaseGrafanaLokiPrometheus
ObservabilityCON Day 3 recap: What’s new in Loki 2.0, tracing made easy with Tempo, observability at the Financial Times, and a Minecraft NOCEventsGrafanaLokiTempo
Grafana 7.3 released: Support for the Grafana Tempo tracing system, new color palettes, live updates for dashboard viewers, and moreGrafanaRelease
Take Grafana Labs' 5th annual Observability SurveyThe Observability Survey is your chance to weigh in on the pressing issues facing observability leaders and practitioners today. Take it today and enter for a chance to win special Grafana swag.Observability
Grafana Labs named a Leader again in the 2026 Gartner® Magic Quadrant™ for Observability PlatformsObservabilityGrafana Cloud
Coverage-first or cost-first: two ways to automatically apply Adaptive Metrics' recommendations Adaptive TelemetryAdaptive MetricsGrafana CloudCost management
Manage your OpenTelemetry Collectors with Fleet Management in Grafana CloudFleet ManagementGrafana AlloyGrafana Cloud
Manage synthetic checks at scale: Introducing folders in Grafana Cloud Synthetic MonitoringSynthetic monitoringGrafana Cloud